6/20 SPY Trade Plan
Can the bulls keep this going?
Readers,
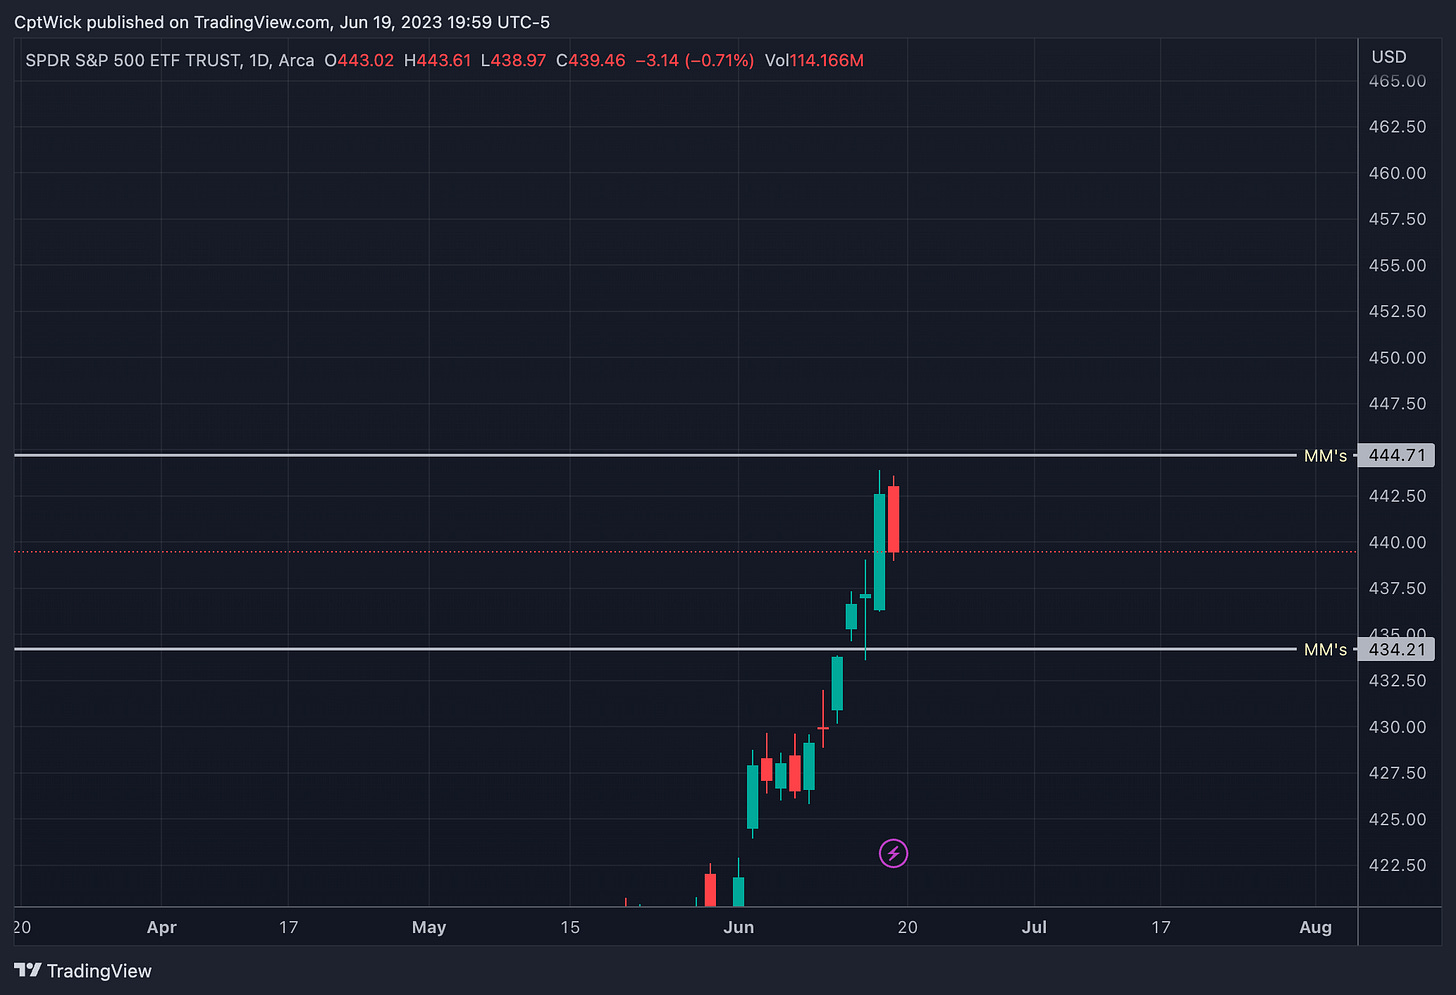
We have a short trading week and the MMs (market makers) are expecting a range of $5.25. That gives us a upper range of 444.71 and a lower range of 434.21.
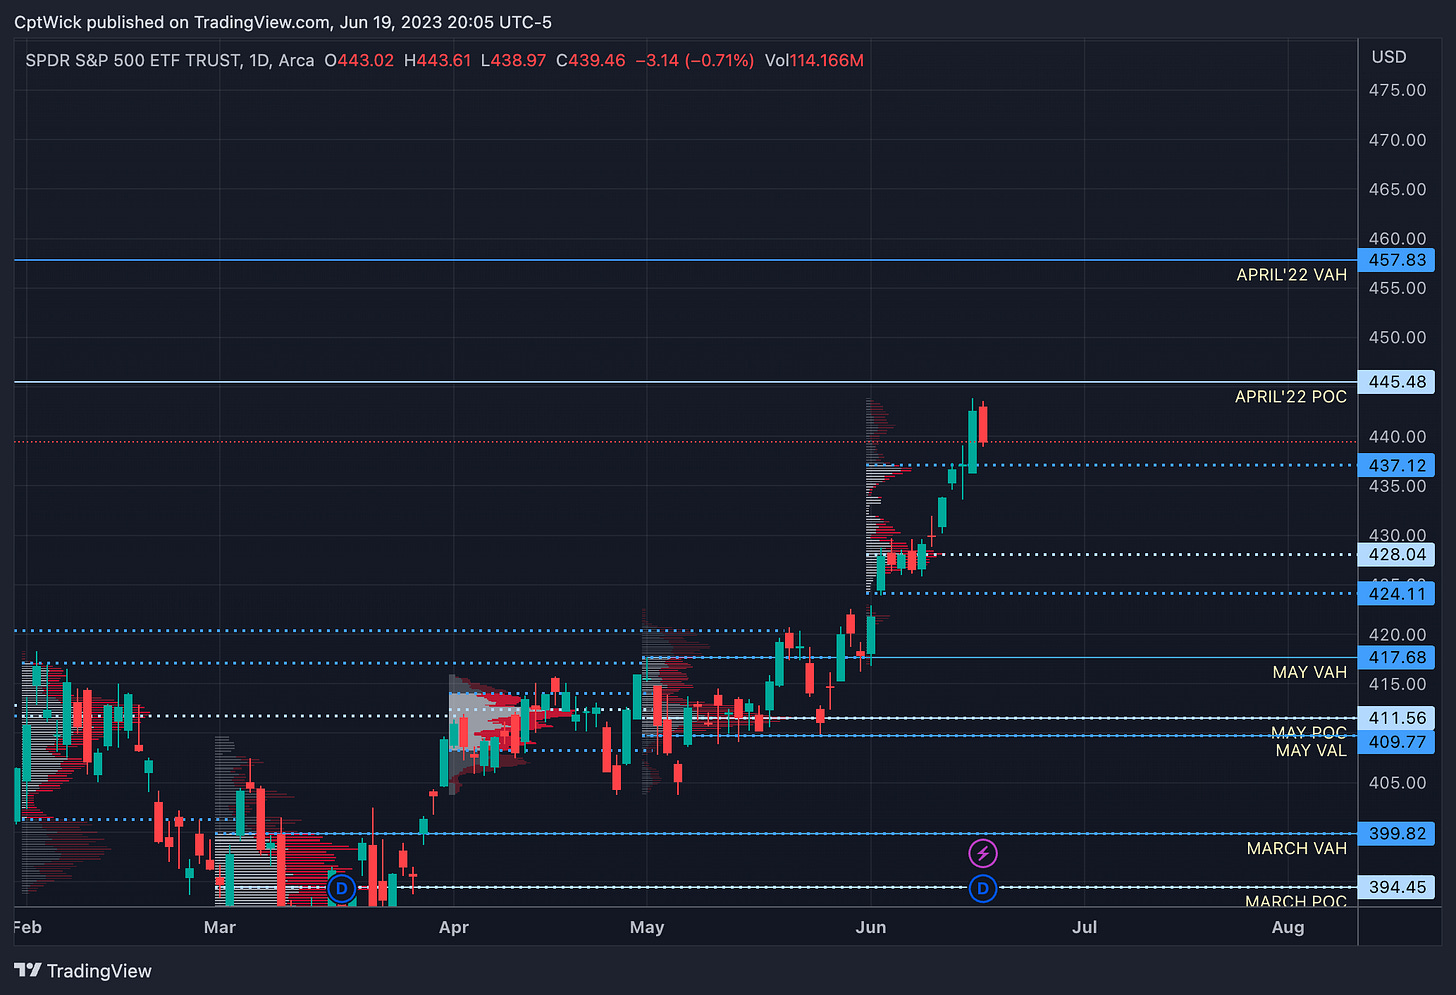
On the monthly we are still at an imbalance to the upside, above this current months VAH at 437.12, POC at 428.04, and VAL of 424.11. We still have that April 22’ naked POC at 445.48 and VAH at 457.83. As a reminder, the current monthly profile is still dynamic, the levels will adjust with volume. These levels are still important on the current profile but we need to look at a different timeframe to make a more informed decision.
When we look at the weekly profile, you can see we ended the profile balanced or inside of value. The VAH is at 441.84, POC at 436.69, and VAL of 435.11. This zone is very important for future price action IMO (in my opinion). If we lose this zone it’s possible that we go a test the waters at the next naked value area sitting 429.03-426.38. We also have a gap to fill sitting at 423.95-422.92. If we use this area as a base, I would expect 445+ to trade. I will update the profile if we breach 447.
Positive Gamma
427, 438-440, 452
Negative Vanna
427, 438, 441-450
Key levels above
Key levels below
Happy Trading,
—WICK—
To cover our basis…
Welcome to my Substack where I provide a daily SPY trading plan to help guide my intraday trading. The purpose of this letter is not to advice you on your trading or investment decisions. I am simply documenting my daily trading plan for myself to help with planning and execution. These are simply my opinions and the data sourced from the likes of vol.land, TradingView, Quantdata.us and others. The stock market is risky, gains are not guaranteed. This is not about getting rich quick, but learn to educate yourself and make the necessary financial decisions on your own. This is not financial advice.


