
This is a free preview of what our ES/SPX Weekly Trade Plans look like when you are a subscriber to Volland and joined the Volland Discord.
Anchor
The dealer book is the senior read and it reads range-bound: work both edges, no lean, reduced conviction. Monday was a half session — cash shut for Labor Day, ES ran 7,728 down to 7,703 and stopped at 1:00 PM ET.
Two prices, one anchor. Every level here is struck against Friday’s cash close, SPX 7,712 / ES 7,717 — that is what the header quotes and what the board was measured at. ES has since traded to 7,707, about 11 points below; no level moves, and Setup D is the only one written off the live futures clock.
The read:
Vanna is the load-bearing force, and it is a pull rather than a barrier. Dealers hold roughly $1.10B of long vanna across the chain, with the heaviest node at SPX 7,800 / ES 7,805 (+$605.1M) — as volatility comes out, that level draws price toward it.
Gamma splits by horizon, and the front of the book is the jumpy half. About +$143M of long gamma across all expirations dampens the week, but this week’s expirations print negative gamma — Tuesday’s alone near -$37M — and the negative stretch runs from SPX 7,700 / ES 7,705 down to SPX 7,600 / ES 7,605. Inside that stretch a move gets to run before the longer-dated book leans against it.
Trade it at the edges:
Buy zone — SPX 7,605-7,618 / ES 7,610-7,623. This is where gamma turns positive again over the largest block of dealer inventory on the board, with the prior-week low and the value-area low stacked on it. It is earned by a flush that reaches the zone and then reclaims, not by the shallow bounce on the way down.
Backup buy — SPX 7,630 / ES 7,635. If the flush stalls before the buy zone, this is the level to work instead: the last structure above the floor zone, carried by the monthly and all-expiration books so it survives Friday’s expiration, with $373.2M of net-long dealer inventory behind it. Shallower and less well-funded than 7,605-7,618, so it is the lesser of the two — take it on the same reclaim evidence, not on first touch.
Fade zone — SPX 7,778-7,795 / ES 7,783-7,800. Only after price pushes above SPX 7,800 / ES 7,805 and fails back under it. Never a blind short into the heaviest node on the board.
In between — wait, don’t chase. Price is already inside the dense band from SPX 7,700 / ES 7,705 up through SPX 7,725 / ES 7,730, and the 0DTE close magnet for Tuesday sits in that same band. The levels that matter this week are the ones price is touching, so let it come to a named one rather than paying up between them.
What changes the frame:
Break up: a daily close above SPX 7,800 / ES 7,805 ends the range read and opens SPX 7,850 / ES 7,855, then SPX 7,900 / ES 7,905.
Break down: losing SPX 7,700 / ES 7,705 puts price inside the permissive stretch that runs to SPX 7,600 / ES 7,605 — which is where the buy zone lives. A daily close below SPX 7,575 / ES 7,580 ends the range read on that side.
Catalysts: PPI Thursday at 8:30 AM ET, Oracle and Adobe both after Thursday’s close, CPI Friday at 8:30 AM ET — into a September 16 Fed meeting that futures price at roughly a 56-63% chance of a 25 basis point hike. Volatility is compressed at spot VIX 14.25, which is what makes a range read credible and is also the fastest thing here to change.
How to read the Greeks in this plan (one-time key — skip it once it’s familiar):
Gamma is structure, and which side of spot it sits on sets its meaning. Positive gamma above spot acts as resistance, positive gamma below spot acts as support, and negative gamma is permissive on both sides — it lets price accelerate through a level rather than absorbing the move.
Vanna is a volatility-driven magnet, and it is sign-only — no side flip. Positive vanna pulls price toward the level and negative vanna pushes price away wherever the level sits; both readings assume implied volatility is moving, so with vol flat there is no vanna pull to trade.
Regime Read
Regime: range-bound — fade both extremes, no lean.
Why: Dealer gamma is net-long — it pins price and contains moves, structured inside a defined band; the higher-timeframe trend is up (the daily, weekly and monthly point the same way). Net: fade the edges, don’t chase the middle.
Leg — the buy zone, SPX 7,605-7,618 / ES 7,610-7,623. That zone is the leg because it is where gamma flips from negative to positive over the board’s largest net-long dealer block, with the prior-week low and the value-area low stacked on the same prints. It is the one place below price where the book stops being permissive and starts absorbing, which is why the week is worked from there rather than from the band edge.
The band: SPX 7,650 / ES 7,655 to SPX 7,790 / ES 7,795 — held by the 1-week and 2-week floor at SPX 7,650 / ES 7,655 and the 2-week pivot at SPX 7,790 / ES 7,795.
How the levels below price stack. Four different things sit under spot and it is easy to read them as one — they are not:

The band floor and the floor zone are different levels doing different jobs: 7,650 is where containment is measured, 7,600-7,630 is where the book actually turns. A flush through 7,650 is not a break — it is the move toward the zone that pays.
Triggers: these two edges are the containment boundary. A confirmed break above SPX 7,800 / ES 7,805 is the breakout — the next leg up; a confirmed break below SPX 7,575 / ES 7,580 is the breakdown — the next leg down.
The better-funded edge is beneath price, so the trade worth waiting for is a flush into the SPX 7,600 / ES 7,605 gamma flip and the reclaim off it — and nothing on the short side is worth taking until a poke above the SPX 7,800 / ES 7,805 wall has actually failed back under it.
Dealer Positioning
One-line read: dealers dampen from the monthly expiration outward and amplify inside this week, so the SPX 7,800 / ES 7,805 ceiling and the SPX 7,600 / ES 7,605 floor are real walls while the stretch between SPX 7,700 / ES 7,705 and the floor travels faster than the distance suggests.
(1) Gamma — the structure force, the wall dealers defend, so pushes into it tend to stall.
Across every expiration dealers are net long gamma at +$142.8M, and more than half of that sits in one place: the SPX 7,800 / ES 7,805 ceiling carries +$84.4M, the largest single wall on the board. Rallies into it decelerate rather than accelerate.
In this week’s and next week’s books the same dealers are net short gamma (-$44.7M and -$45.6M), and there is no defended wall between the SPX 7,700 / ES 7,705 shelf and the SPX 7,600 / ES 7,605 floor. Short gamma there means hedging goes with the move, so that stretch behaves like stairs rather than a cushion.
The asymmetry: the heavier structure is a single overhead wall built out of expirations that survive Friday, while the support beneath price is spread thin across near-dated shelves. One hard ceiling, one hard floor, and a soft pocket in between.
(2) Vanna — the volatility force, a vol-driven magnet: falling volatility pulls price toward it.
Dealers are net long vanna in every window (+$1.05B in the one-week book, +$908M monthly, +$1.10B across all expirations), and the largest node sits at the same SPX 7,800 / ES 7,805 ceiling (+$605.1M). With implied volatility at the low end of its one-year range, a long-vanna book quietly buys as volatility bleeds — a slow pull up toward that ceiling, not a trigger.
The catch is the sign below spot: vanna at the SPX 7,600 / ES 7,605 floor is negative (-$339.3M), as it is at SPX 7,500 / ES 7,505 (-$351.7M). A flush that arrives with volatility rising gets pushed away from those floors instead of drawn into them, so a quiet drift down into the floor is worth more than a panic into it.
(3) Delta — dealer inventory: what is parked at a level and which way it leans.
This is positioning dealers already hold and have already hedged, never pending buying or selling. Far more of it is parked below spot than above, and the two deepest shelves are the SPX 7,600 / ES 7,605 floor ($20.6B net long) and SPX 7,500 / ES 7,505 ($18.1B).
That is why those two strikes act as the base of the range while the shelves between them behave like steps. Charm — time-decay drift that firms up as expiration nears — is small and negative, and only matters into Tuesday’s close, where it firms the SPX 7,710-7,725 / ES 7,715-7,730 pin band.
What that means by zone:
SPX 7,710-7,725 / ES 7,715-7,730 — Tuesday’s pin band. Two-sided chop while the 0DTE expiration is alive; it does not exist on Wednesday.
SPX 7,610-7,700 / ES 7,615-7,705 — the short-gamma pocket. Stair-step slides that run further and faster than the level spacing implies; levels here slow price, they do not stop it.
SPX 7,600 / ES 7,605 — where gamma flips positive over the deepest inventory on the board. A quiet drift into it gets bought; a volatility-expansion flush can undercut it before it holds.
SPX 7,750 / ES 7,755 — an accelerant, not a fade. The one-day book is short gamma at this strike, so a push through it runs.
SPX 7,775-7,800 / ES 7,780-7,805 — grind and stall. Price is drawn up into the wall and decelerates in it.
Posture: volatility is compressed and easing — VIX 14.25, down 0.03 on the session and near the bottom of its range. That is a supporting read, not a neutral one: a compressed, falling surface is what lets a containment structure hold, and it is why the levels above are worth trading from rather than fading blind. What this board does not carry is a spot-vol beta — the measure of how hard a move in volatility pushes price — so this plan does not claim a direction for that link. The strike structure carries the read; vol tells you the weather it is happening in.
Structure Overview
The board is a box with a hard ceiling, a hard floor and a soft middle, and price is sitting in the lower half of it — not the middle.
Where price actually is. Cash was closed Monday for Labor Day; ES traded a shortened session that halted at 1:00 PM ET, last trading at 7,707 futures after printing a 7,703 futures low. The board’s own spot is Friday’s frozen cash close — 7,712 cash, 7,717 futures — so every level below is quoted against a market that has already ticked down toward the pocket.
The rails. The ceiling is a zone, not a tick: SPX 7,775-7,800 / ES 7,780-7,805, where the board’s peak gamma wall and its peak vanna node sit on top of each other. The floor is also a zone: SPX 7,600-7,630 / ES 7,605-7,635, where gamma flips positive over the deepest dealer inventory on the board.
The middle is where you wait. Between SPX 7,700 / ES 7,705 and the floor the near-dated books are short gamma with no wall to defend, so the shelves at SPX 7,675 / ES 7,680, SPX 7,660 / ES 7,665 and SPX 7,650 / ES 7,655 are stairs a flush walks down rather than places price stops. Work the edges of the box and wait in the middle for price to come to a level.
The one intraday exception. Tuesday carries a live expiration whose charm turns over inside SPX 7,710-7,725 / ES 7,715-7,730. That band is a close magnet for one session only and is gone on Wednesday.
The week’s shape. For ES the week runs from Monday’s shortened session through Friday; for SPX cash it starts Tuesday, with a live expiration that day and again at Friday’s weekly expiration. Friday thins every near-dated anchor between SPX 7,700 / ES 7,705 and SPX 7,750 / ES 7,755 and leaves the month-carried levels standing.
What would change the architecture. A daily close above SPX 7,800 / ES 7,805 turns the ceiling into a floor; a daily close below SPX 7,575 / ES 7,580 ends the box on the downside. Short of one of those, this is a two-sided map.
Term Structure
Classification: BALANCED
Read the row that matches how long you intend to hold. The one-day and one-week rows are today’s and this week’s range; the monthly and all-expiration rows are the structure a swing position sits on. Support and resistance are quoted for every window in the table, each with the DTE to trade it — a one-day level is not tradeable with a monthly option, and the reverse is worse.
The split that matters is a sign change, not a concentration. Dealers are short gamma in the one-week and two-week books (-$44.7M and -$45.6M) and long from the monthly expiration outward (+$51.2M monthly, +$142.8M across all expirations) — short into the pocket beneath spot, long into the SPX 7,800 / ES 7,805 wall above it. So the further out you look, the more the book dampens; inside this week it amplifies. That is why the shelves running down from SPX 7,700 / ES 7,705 toward the floor behave like stairs, while the SPX 7,800 / ES 7,805 ceiling is a genuine cap — its resistance is built in the monthly and all-expiration books, which are not going anywhere.
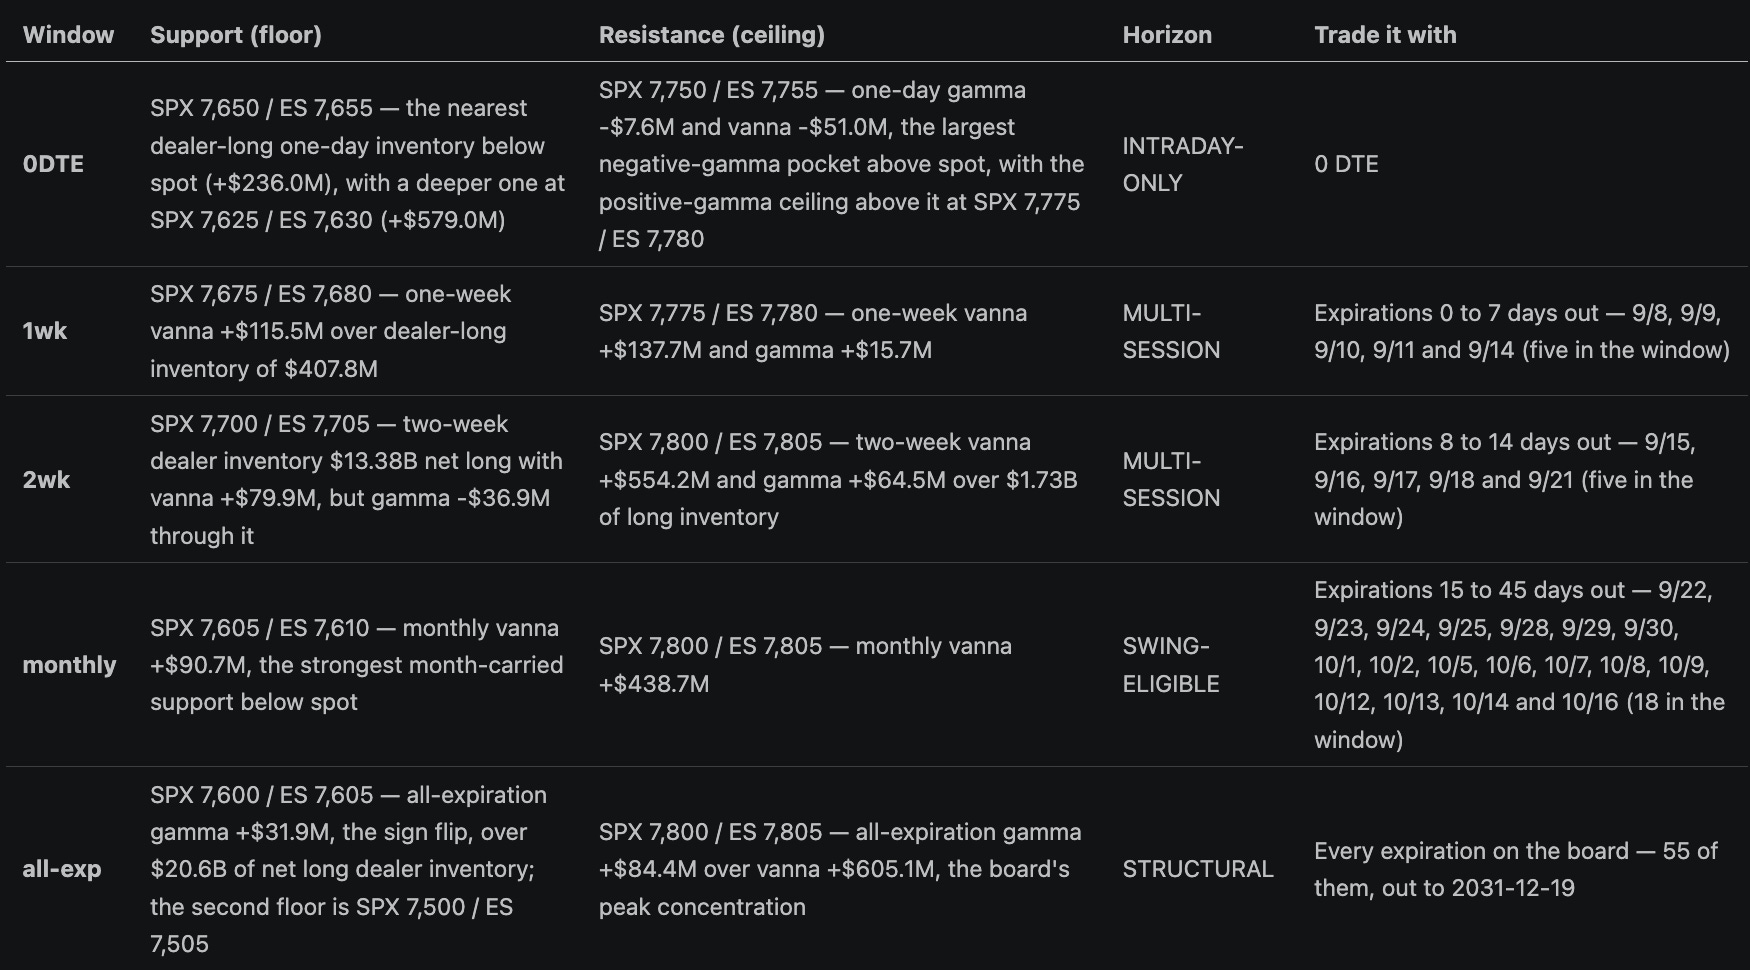
Carry implication: Month-carried and survives Friday’s expiration: SPX 7,605 / ES 7,610, SPX 7,630 / ES 7,635, SPX 7,660 / ES 7,665, SPX 7,775 / ES 7,780 and SPX 7,800 / ES 7,805 — those are the structural anchors a swing can be hung on. The SPX 7,700 / ES 7,705, SPX 7,725 / ES 7,730 and SPX 7,750 / ES 7,755 anchors are two-week levels that thin out after next week’s expiration, and the SPX 7,717 / ES 7,722 pin is a one-day level that does not exist on Wednesday.
Vol Regime Context
VIX 14.25 spot
The volatility regime is LOW and compressing. Spot VIX printed 14.25 on this read — below the 15.86 line that separates low from normal on the one-year baseline, and around the 10th percentile of the past year. The baseline was refreshed today, so that is a live comparison rather than a stale one, and it barely moved from the prior read at 14.28.
What compression does here. It is the fuel for the long-vanna dealer books. While implied volatility keeps bleeding, the dampening levels above and below tighten the box rather than break it, and the pin band into Tuesday’s close firms up.
What expansion does. It inverts the read. The vanna support at SPX 7,675 / ES 7,680 strengthens on falling volatility and flips against you on a genuine expansion, and vanna at the SPX 7,600 / ES 7,605 floor is negative — so a flush that arrives with volatility rising is repelled from the floor instead of drawn into it.
Standard polarity is in force. Implied volatility sits at the low end of its baseline, so the elevated-volatility inversion that flips how vanna levels behave is not switched on this week.
Vol Read + Catalyst Impact
The spot-volatility relationship did not resolve on this pull, so this plan does not claim one. What that costs is a confirmation, not a level: the spot-vol gauge is what tells you whether dealer hedging has decoupled from its usual response to price. Nothing is frozen and no range-bracket override applies, but nothing is being confirmed either.
Read it off the structure instead. The dealer books say what the gauge normally would. Long vanna at the SPX 7,800 / ES 7,805 ceiling means falling volatility pulls price up into the wall and stalls it there; negative vanna at the SPX 7,600 / ES 7,605 floor means a volatility-driven flush is pushed away from the floor rather than into it. Quiet strength gets further than violent strength, and quiet weakness finds a bid where violent weakness does not.
Catalyst impact. Thursday’s PPI and Friday’s CPI are the two catalysts that can re-price the whole board, with the 10-year and 30-year auctions and two after-the-close earnings reports on either side of them. A catalyst that expands volatility does more than move price: it flips the sign on how the SPX 7,675 / ES 7,680 shelf and the SPX 7,600 / ES 7,605 floor behave, which is why a level that held all week can fail on the print.
Until then. The board is compressed and the structure is doing the work. Levels are the read this week; the volatility data is a caveat on it, not a second opinion.
Intraday Execution Layer — Tuesday 0DTE
Intraday levels only — the weekly range above still runs the show. Use them to time entries inside it, not to flip the bias.
0DTE hinge SPX 7,717 / ES 7,722 — where the 0DTE book flips from one side of the tape to the other. The series crosses 9 times, so this is the crossing nearest price, not a single unambiguous pin.
Review the updated 0DTE data in Volland through the session — Delta Decay is a live, at-price positioning tell that fluctuates as 0DTE positions build and unwind, so re-check the board intraday and let it lead the 0DTE read.
0DTE expiry only — every level below wipes at today’s cash close. By convention the session hands off gamma 9:30-10:30 ET, then vanna 10:30-2:00 ET, then charm 1:30-3:30 ET — a typical sequence, not a measurement off this pull.
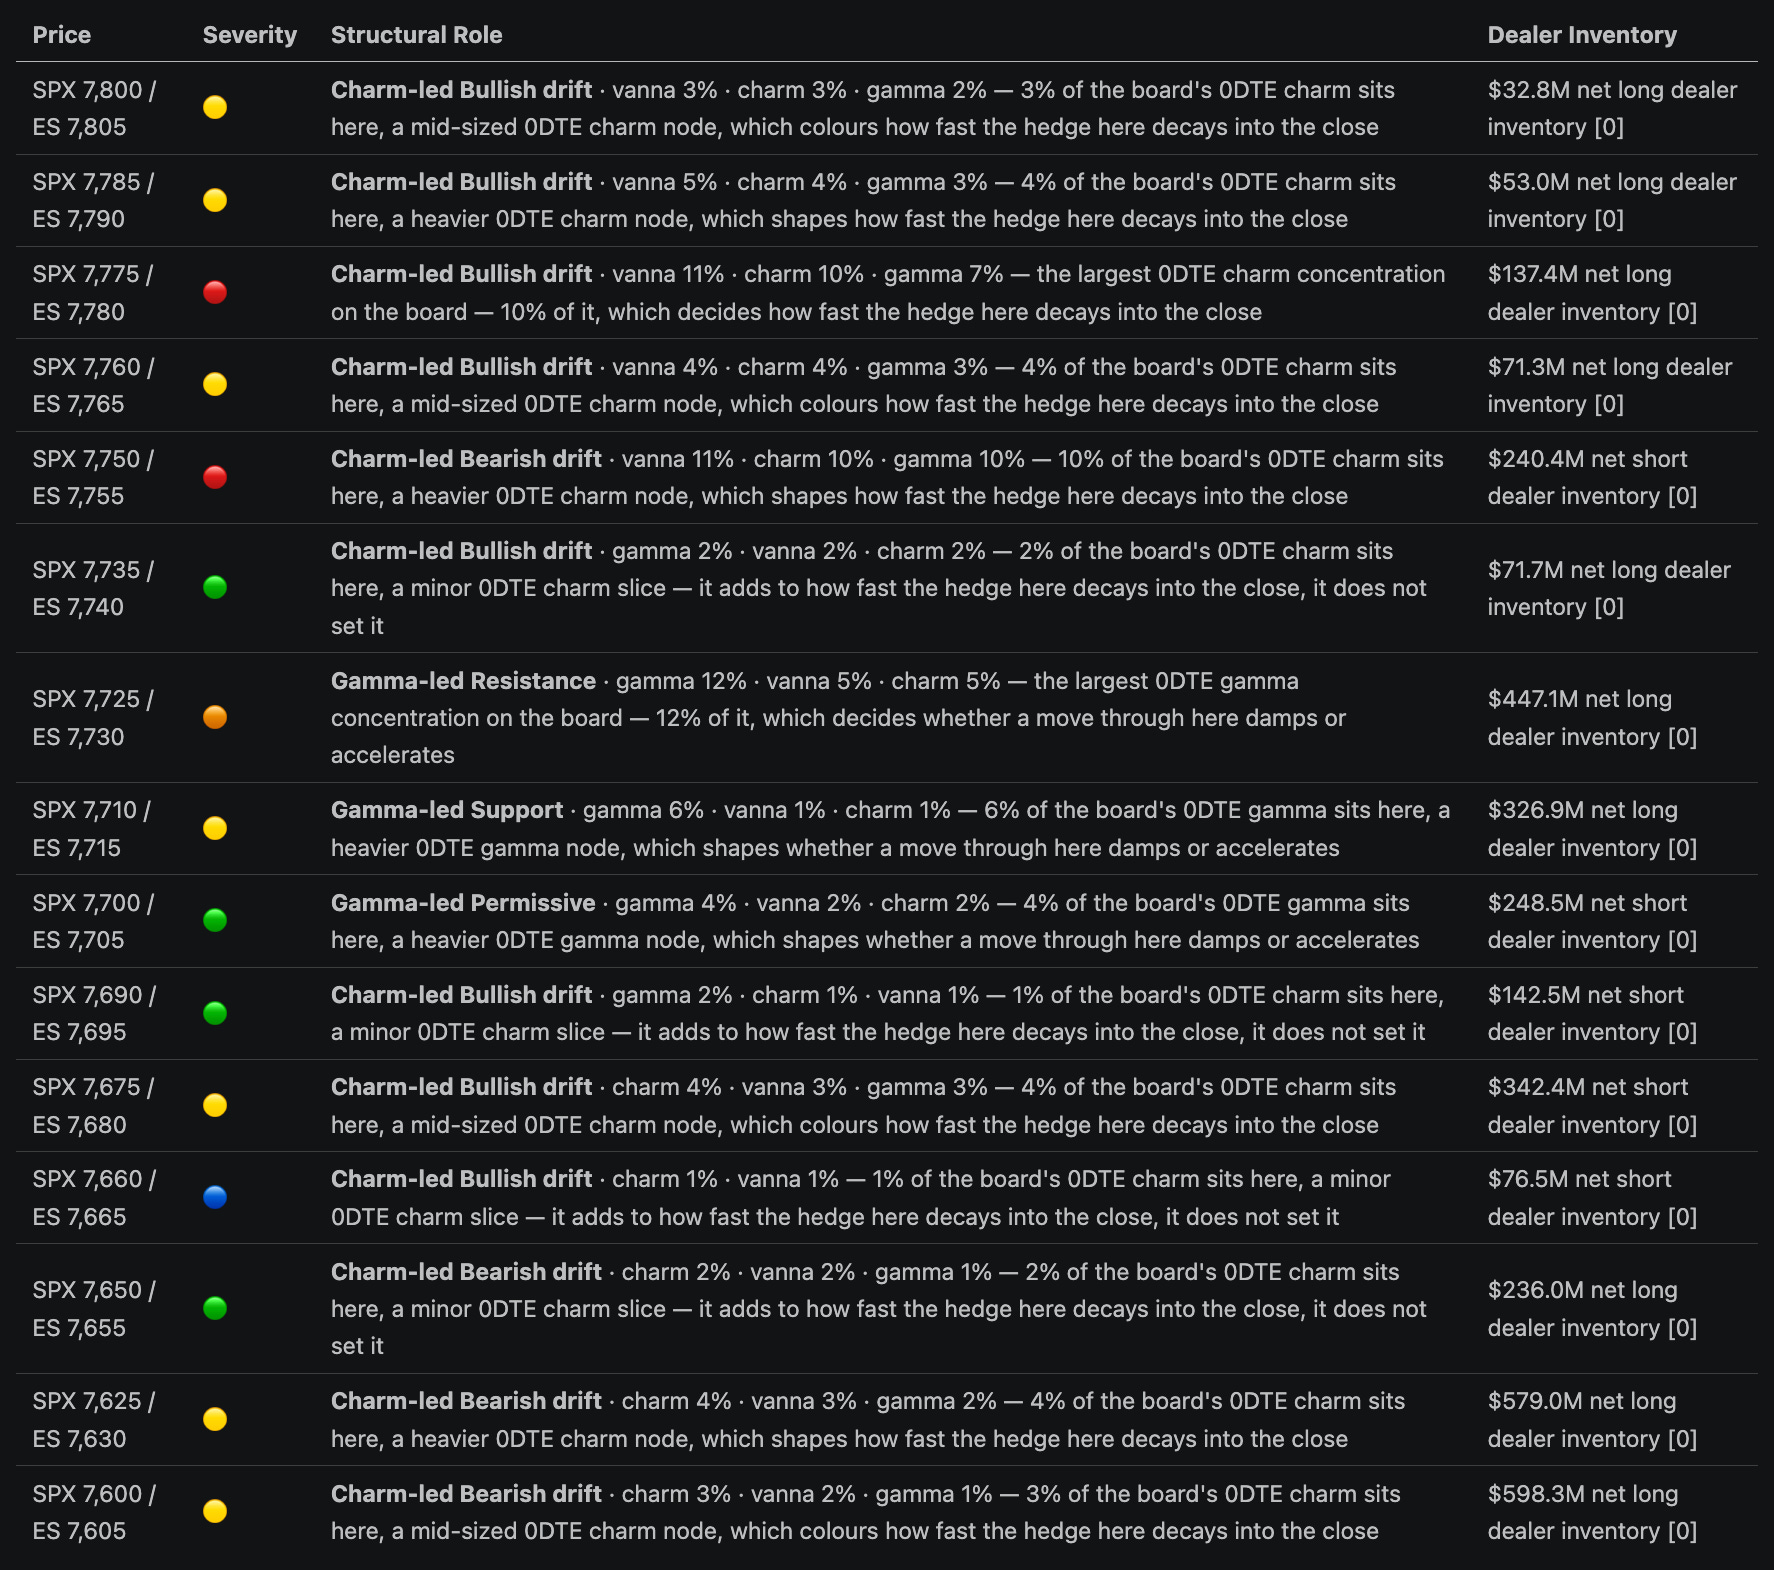
0DTE setup shaping (Tuesday). These setups are shaped by the 0DTE framework — anchored to strikes within ~55 points of spot (one opening straddle), and read Delta Decay first as the 0DTE positioning tell once the session is live:
Setup D — out-of-bounds > SPX 7,620 / ES 7,625 (dealers hedge immediately — invalidation/acceleration); pin/brakes at SPX 7,717 / ES 7,722.
Key Levels Table
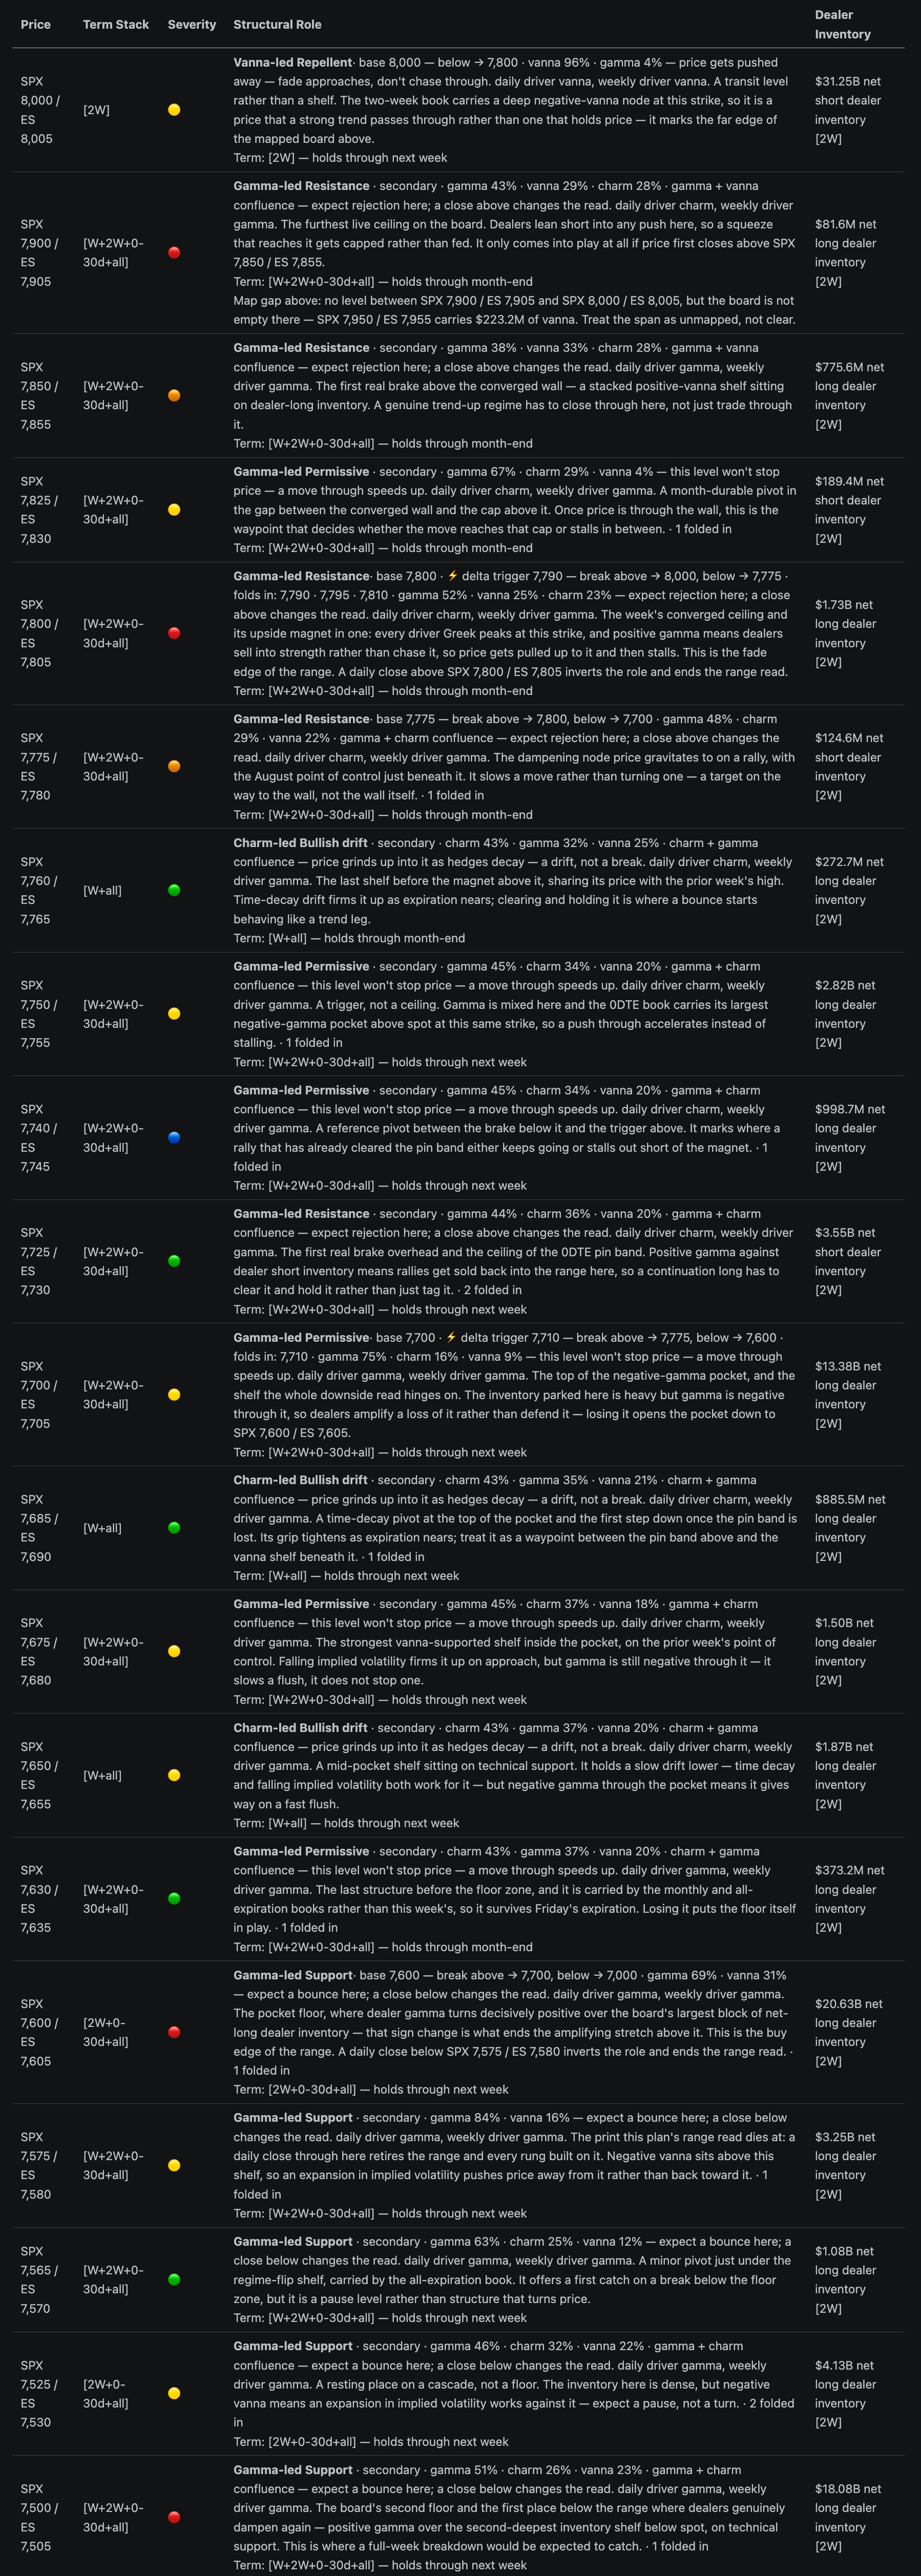
All levels paired SPX cash / ES futures (ES = SPX + 5.0). Severity icons: 🔴 critical / 🟠 strong / 🟡 moderate / 🟢 supportive / 🔵 reference-only.
Term Stack legend: [0] 0DTE (today’s expiry) · [W] Weekly · [2W] Two-week · [M] Monthly · [0-30d] the first month of expirations · [all] all expirations · [Y] Yearly · [chart] chart-anchor only. Tags concatenate with + to show confluence.
Dealer Inventory column: how much dealer delta is parked at that strike, and which way it leans — what dealers hold there, not what they are about to do. It is a size reading: a big number means moves through here are violent, not that the level holds, and it says nothing on its own about direction. What the level does is the Greek read in Structural Role.
Driver legend: vanna-led = volatility-driven — rising implied volatility makes this level act on price harder, falling implied volatility takes the force out of it · gamma-led = structural — it holds or breaks on price itself · charm-led = time-decay — its grip changes with the clock, not with price · a + confluence callout = two forces stacked, added conviction.
Structural Ladder
⏫ UPSIDE LEG 4 ───────────────────────────────────
 SPX 8,000 / ES 8,005   █████████  vanna -$1.24B [2W] — Negative-vanna transit node · → 7,800
 SPX 7,900 / ES 7,905   ████████  gamma +$22.8M [W+2W+0-30d+all] — Furthest live ceiling · secondary
⏫ UPSIDE LEG 3 ───────────────────────────────────
 SPX 7,850 / ES 7,855   ██████████  gamma +$16.4M [W+2W+0-30d+all] — Cap above the wall · secondary
 SPX 7,825 / ES 7,830   ████  gamma -$7.0M [W+2W+0-30d+all] — Waypoint above the wall · secondary
⏫ UPSIDE LEG 2 ───────────────────────────────────
 SPX 7,800 / ES 7,805   ███████████████████  gamma +$84.4M [W+2W+0-30d+all] — The week's converged ceiling · shelf 7,790–7,810 · → 8,000 / 7,775
⏫ UPSIDE LEG ───────────────────────────────────
 SPX 7,775 / ES 7,780   █████████  gamma +$30.8M [W+2W+0-30d+all] — Upside Resistance, not wall · → 7,800 / 7,700
 SPX 7,760 / ES 7,765   ██████  charm +$340K under $20.3M bar [W+all] — Last shelf before Bullish drift · secondary
 SPX 7,750 / ES 7,755   ███████████████████  gamma +$12.0M [W+2W+0-30d+all] — Trigger, not a ceiling · secondary
🎯 CURRENT LEG (SPX 7,700-7,740 / ES 7,705-7,745 — the rungs bracketing spot) ────────────────
 SPX 7,740 / ES 7,745   ████████  gamma +$3.9M under $4.2M bar [W+2W+0-30d+all] — Pivot below the trigger · secondary
 SPX 7,725 / ES 7,730   █████████████████████  gamma +$10.0M [W+2W+0-30d+all] — First real brake overhead · secondary
 >>> SPOT SPX 7,712 / ES 7,717 <<<
 SPX 7,700 / ES 7,705   █████████████████████████████  gamma -$36.9M [W+2W+0-30d+all] — Top of the pocket · shelf 7,710–7,710 · → 7,775 / 7,600
⏬ DOWNSIDE LEG ─────────────────────────────────
 SPX 7,685 / ES 7,690   ███████  charm +$100K under $20.3M bar [W+all] — First step below pin · secondary
 SPX 7,675 / ES 7,680   ██████████████  gamma -$18.8M [W+2W+0-30d+all] — Vanna shelf inside pocket · secondary
 SPX 7,650 / ES 7,655   ████████████████  charm +$754K under $20.3M bar [W+all] — Mid-pocket shelf on Bullish drift · secondary
⏬ DOWNSIDE LEG 2 ─────────────────────────────────
 SPX 7,630 / ES 7,635   ██████  gamma -$5.5M [W+2W+0-30d+all] — Last structure above floor · secondary
 SPX 7,600 / ES 7,605   ████████████████████████████████████  gamma +$31.9M [2W+0-30d+all] — Pocket floor, buy edge · → 7,700 / 7,000
 SPX 7,575 / ES 7,580   ███████████████  gamma +$9.1M [W+2W+0-30d+all] — Regime-flip print below floor · secondary
⏬ DOWNSIDE LEG 3 ─────────────────────────────────
 SPX 7,565 / ES 7,570   ████████  gamma +$3.1M under $4.2M bar [W+2W+0-30d+all] — Minor catch below flip · secondary
 SPX 7,525 / ES 7,530   █████████████████  gamma +$10.3M [2W+0-30d+all] — Resting place on cascade · secondary
 SPX 7,500 / ES 7,505   ██████████████████████████████████  gamma +$20.3M [W+2W+0-30d+all] — The board's second floor · secondary
⏬ DOWNSIDE LEG 4 ─────────────────────────────────
 SPX 7,485 / ES 7,490   █  ⊘ gamma +$900K under $4.2M bar [W+2W+0-30d+all] — Thin reference under floor · secondary
 SPX 7,000 / ES 7,005   ███████████  ⊘ vanna -$2.03B [all] — Far marker, structure resets · → 7,600
Read the ladder as a box with two live edges and a long stretch of transit in between.
The ceiling edge is SPX 7,800 / ES 7,805. Every driver Greek converges there and dealer gamma is positive, so pushes into it get sold rather than chased — it is a magnet first and a wall second. Above it the structure thins into the cap at SPX 7,850 / ES 7,855 and the furthest ceiling at SPX 7,900 / ES 7,905.
The floor edge is SPX 7,600 / ES 7,605. That is where dealer gamma turns positive again over the board’s largest block of net-long dealer inventory, which is what ends the amplifying stretch above it. Beneath it the next genuine dampening is the second floor at SPX 7,500 / ES 7,505.
The middle is where price travels, not where it turns. From the pin band at SPX 7,710 / ES 7,715 down to the floor, gamma is negative — dealers amplify moves through this stretch instead of absorbing them, so a flush covers ground faster than the rung spacing suggests. Wait for price to reach an edge; the middle is transit, not an entry.
The rung that decides the session is SPX 7,700 / ES 7,705. It carries the heaviest inventory on the near board, but gamma is negative through it, so it gets amplified rather than defended when it goes. Holding it keeps the pin band in reach; losing it opens the pocket.
Two prints retire this read. A daily close above SPX 7,800 / ES 7,805 turns the ceiling into support and the week becomes trend-up. A daily close below SPX 7,575 / ES 7,580 ends the range and the rungs built on it.
Bias
Base case: the corridor holds and both edges get worked. Dealer gamma is net long at the SPX 7,800 / ES 7,805 wall (+$84.4M all-expiration, the board’s peak concentration) and net long again at the SPX 7,600 / ES 7,605 flip (+$31.9M) — two dampeners with a stretch of negative gamma strung between them. Price sits on the lower half of that corridor, so the floor is the nearer and better-funded edge, and there is no net lean either way.
The read, by zone:
SPX 7,710-7,725 / ES 7,715-7,730 — the pin band. Positive gamma across it, and the 0DTE charm series crosses zero at SPX 7,717 / ES 7,722. That is the close magnet: into the afternoon, drift back toward it is the default, and pushing away from it fights the hedge.
SPX 7,650-7,630 / ES 7,655-7,635 — the buy zone. The charm floor at SPX 7,650 / ES 7,655 sits over the gamma shelf at SPX 7,630 / ES 7,635, with the deeper pocket floor at SPX 7,600 / ES 7,605 beneath it. This is where the week’s best-funded long lives.
SPX 7,775-7,800 / ES 7,780-7,805 — the fade zone. One-week vanna is +$137.7M at SPX 7,775 / ES 7,780 — a vol-driven magnet that pulls price in as vol falls — with the gamma wall right above it. A first touch tends to stall rather than break.
In between, there is no dealer structure worth trading against. That is where you wait for price to come to a level, not where you take one.
The tells:
Break-up tell: acceptance above SPX 7,725 / ES 7,730, the first real brake, where dealers hold short inventory against positive gamma. Clear it and hold it and SPX 7,750 / ES 7,755, then the SPX 7,775 / ES 7,780 magnet, open up.
Break-down tell: loss of SPX 7,700 / ES 7,705, the top of the pocket and the same print the rest of this plan names. Below it price is inside the negative-gamma stretch that runs down to SPX 7,600 / ES 7,605, where hedging feeds a move instead of absorbing it — SPX 7,675 / ES 7,680 and then the buy zone arrive faster than the chart suggests. The SPX 7,696 / ES 7,701 shelf a few points beneath is where the continuation long stops out, not where the break is confirmed.
Stand down on a daily close above SPX 7,800 / ES 7,805 or below SPX 7,575 / ES 7,580. Either print ends the corridor read outright — wait for the new frame rather than fading the break.
On Watch This Week
The multi-week frame is a near-balanced level stack inside a compressed-vol tape, and the whole thing hinges on one shelf. Spot enters at 7,712 cash / 7,717 futures, just above it.
The pivot — SPX 7,700 / ES 7,705. The largest near-spot level on the board, and the block of long dealer inventory price is sitting directly on — though the deeper block below spot is the SPX 7,600 / ES 7,605 floor. Everything below reads as one story and everything above reads as another.
If it holds:
A weekly close through the SPX 7,725 / ES 7,730 to SPX 7,750 / ES 7,755 band turns the SPX 7,775 / ES 7,780 to SPX 7,800 / ES 7,805 area from a cap into a springboard.
SPX 7,800 / ES 7,805 is the level to watch up there. It was the level to sell for a month — price tagged it four times and was rejected every time — but the longer-dated dealer positioning at that strike flipped from pushing price away to pulling it in, and the options that damp movement at the strike went from absent to present. The honest caveat: that read is decaying rather than strengthening, no fresh confirmation landed on this board, and the live price-tape leg of its corroboration could not be measured this pull — there was no session series to measure it against. The week’s trend-up print is a daily close above SPX 7,800 / ES 7,805. Nothing in this week’s setup list trades it directly; it is carried in the multi-week book, and its first real confirmation event is the September quarterly expiration.
If it goes:
A weekly close below SPX 7,700 / ES 7,705 hands price to SPX 7,600 / ES 7,605, where three dealer forces line up on the same side and the largest below-spot dealer inventory on the board sits. The week’s trend-down print is a daily close below SPX 7,575 / ES 7,580.
Beneath that the next real shelf is SPX 7,500 / ES 7,505 — roughly 210 points from spot. That gap is an air pocket, not a ladder.
What would change the frame:
Vol. VIX at 14.25 is near the floor of its range, so any expansion re-prices the whole map fast and asymmetrically. Friday already delivered a hawkish sell-off that did not expand vol — that is the specific branch that suspends both multi-week reads rather than confirming either, and this week’s two inflation prints are where it gets tested again.
September quarterly expiration, Friday the 18th. Both reads carry their weight in the two-week and monthly windows that roll clears, so it is the first genuine confirmation-or-dissolution event for each. The S&P rebalance trade prints into the same close.
A standing caution. The SPX 7,700 / ES 7,705 shelf was invalidated once before at an earlier vintage. Treat it as untested, not as proven — its size is not immunity.
Macro Context
The macro week is back-loaded, and it is about one question: whether the Fed hikes on September 16.
Rate path. August payrolls printed 162,000 against roughly 53,000-65,000 expected, with unemployment steady at 4.1%. Fed funds futures moved from under 50% to roughly a 56-63% chance of a 25 basis point HIKE at the September 16 meeting. This is a hike-risk backdrop, not the usual hold-or-cut one.
Nobody can soften it. The Fed is in blackout from September 5 through September 17. Governor Waller’s September 3 lean toward holding was contradicted by the next day’s jobs number, and he cannot revisit it before the decision lands. The data does all the talking this week.
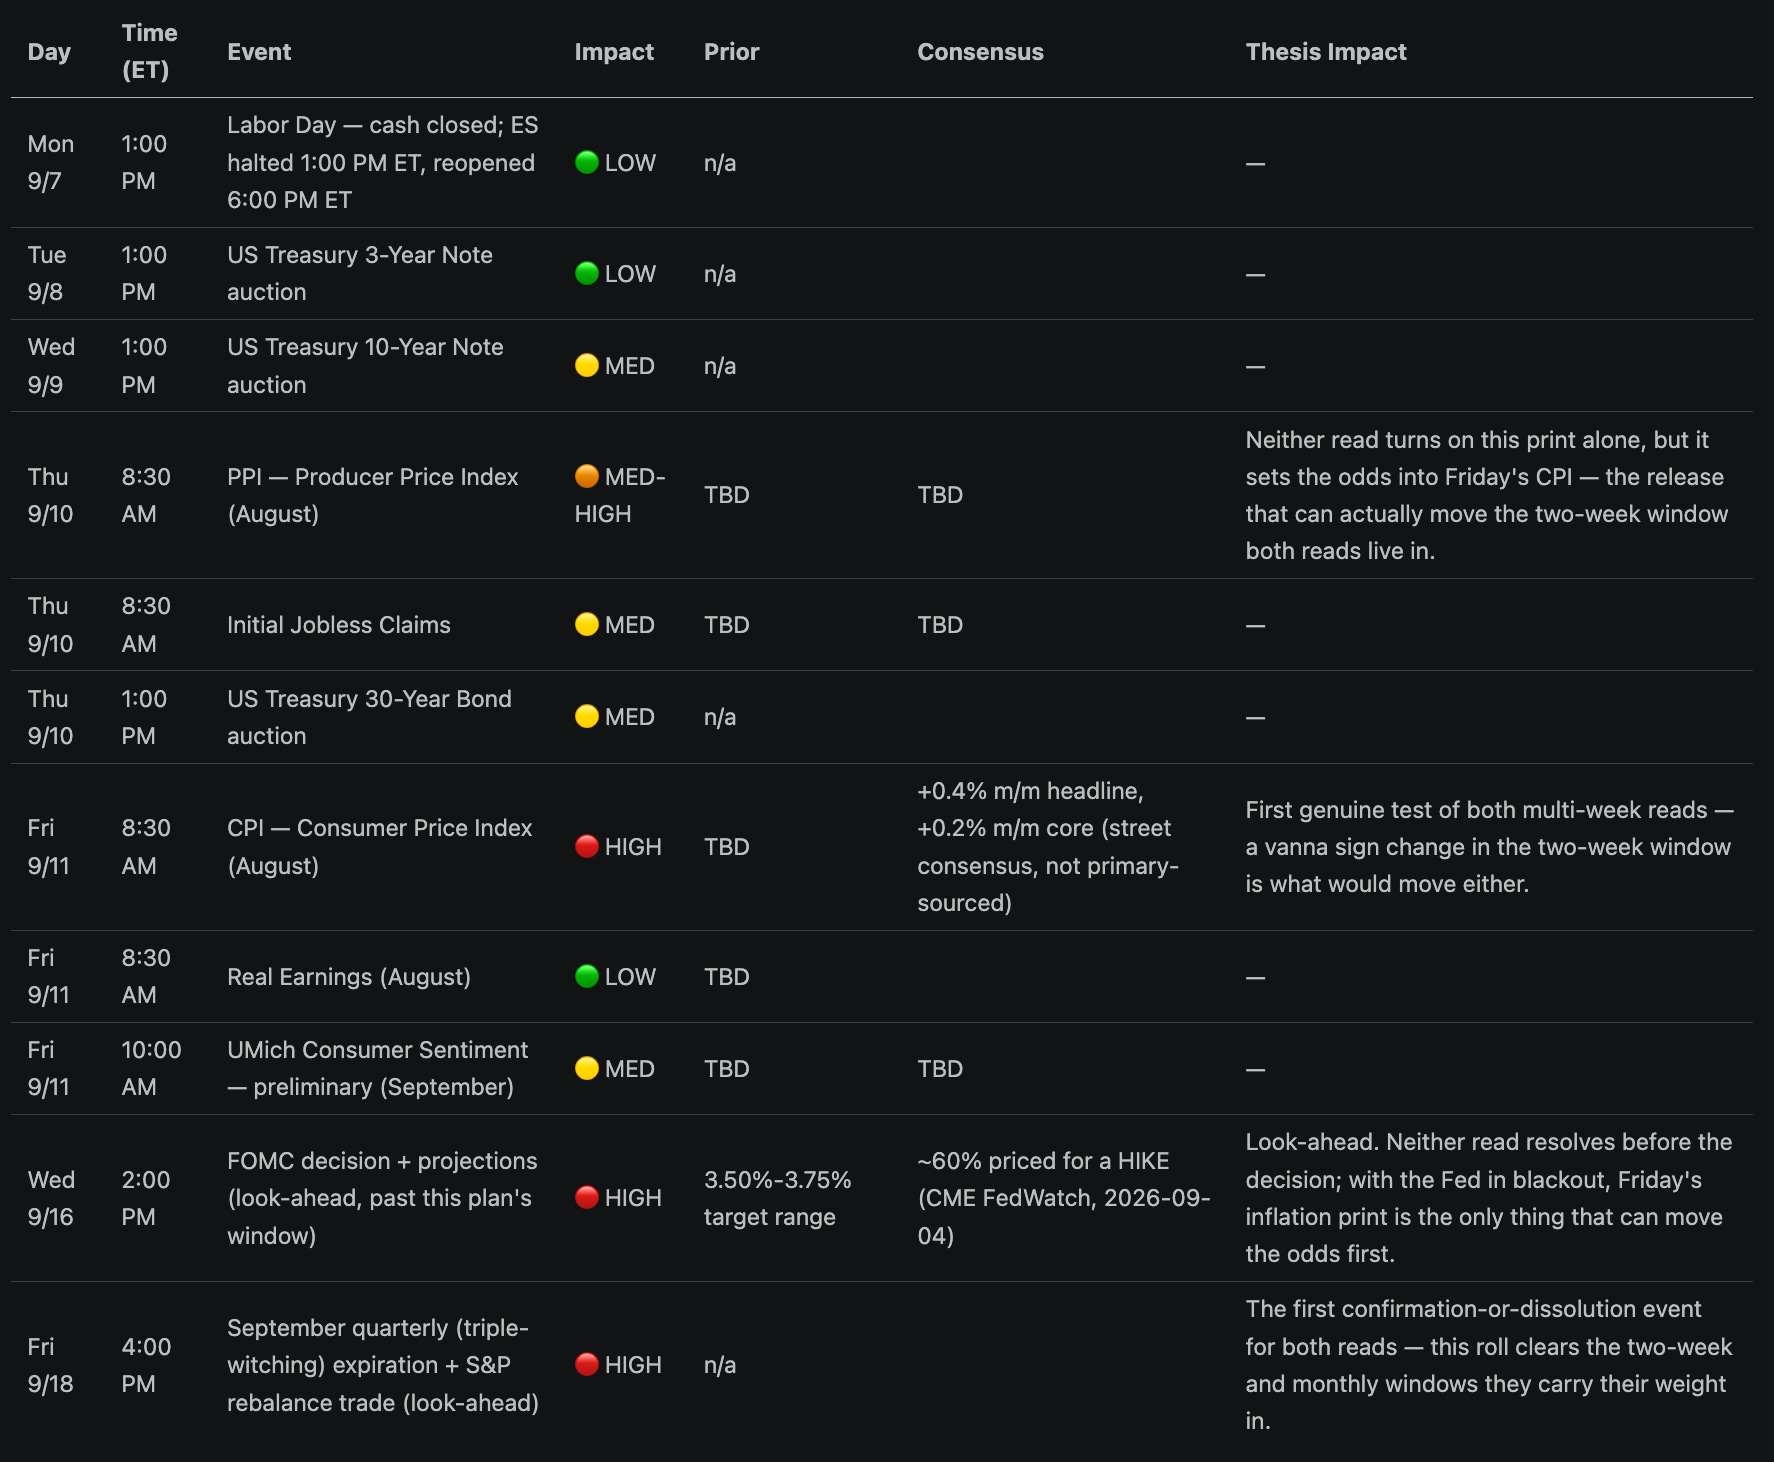
The data. Two inflation prints in the back half: PPI Thursday 9/10 at 8:30 AM ET, CPI Friday 9/11 at 8:30 AM ET. CPI is the only scheduled release left that can reprice the September decision, which concentrates an unusual share of the week’s risk into one 8:30 print. Treasury auctions run 3-year Tuesday, 10-year Wednesday, 30-year Thursday; a poor long-end auction is the cleanest route to higher yields into CPI.
The calendar shape. Monday was Labor Day. S&P cash was closed and equity-index futures traded a shortened session, halting 1:00 PM ET and reopening 6:00 PM ET, with no settlement price published for the date. The futures week runs Monday’s short session through Friday; the cash week starts with Tuesday’s open. Either way the market comes in on Friday’s information set, not a fresh one.
Vol. VIX reads 14.25, around the 10th percentile of its own recent range. Options are priced for a benign week, so there is little cushion if either inflation print surprises — the repricing arrives fast rather than gradually.
Breadth. Participation is neutral and gives no independent lean: about 47% of S&P names sit above their 50-day average, but 35% above the 20-day against 64% above the 200-day. That is a broad long-term base with a narrowing intermediate tape — a caution against any one-way read, not a signal on its own.
Net: nothing binding lands until Thursday, and then everything does. The first half of the week is structure-driven and the second half is event-driven, so a level that holds Tuesday and Wednesday has proved much less than it looks.
Macro Regime Drivers
3 macro forces could shift the regime in the near term — each is mapped below.
September FOMC decision, mid-month (near-term change expected) — Meeting 2026-09-15/16 with projections; target range 3.50%-3.75%. CME FedWatch odds of a HIKE moved to 60.2% from 49.4% on the August payrolls beat, and the Fed is in blackout 2026-09-05 through 2026-09-17 — no official can soften or confirm that repricing before the decision lands.
August CPI print, mid-month (near-term change expected) — Friday 2026-09-11, 8:30 AM ET (BLS). Street consensus around +0.4% m/m headline and +0.2% m/m core (consensus figure, not primary-sourced). Because of the blackout this is the only scheduled release in the window that can reprice the September decision, which concentrates an unusual amount of the week’s risk into one 8:30 print.
September quarterly (triple-witching) expiration, Friday 2026-09-18 (near-term change expected) — The quarter’s largest option roll, with the S&P 500 quarterly rebalance trade printing into the same close (additions and deletions effective prior to the open Monday 2026-09-21). Both active theses carry their weight in the 2wk and monthly windows that this expiration clears, so it is the first genuine confirmation-or-dissolution event for each.
Economic Calendar
Earnings Assessment
WATCH — largely off-cycle for the index, with one awkward cluster.
Thursday 9/10, after the close: Oracle and Adobe both report. These are the two largest technology prints of the week, and they land in the overnight session immediately before Friday’s 8:30 CPI.
Friday 9/11, before the open: Kroger. A consumer read, rarely an index-level driver.
The index-level risk here is the stacking, not either name on its own. A large combined gap out of the two Thursday reports re-weights dealer gamma around the SPX 7,700 / ES 7,705 shelf overnight, so the structure CPI opens into on Friday morning may not be the structure that closed Thursday afternoon. Nothing on the earnings calendar conflicts with the expiration windows the setups are written on.
Setups
Setup A — Pocket-Floor Reclaim LONG at SPX 7,605-7,618 / ES 7,610-7,623 — Grade B
Time Horizon: SWING-ELIGIBLE Carry Rule: Carry permitted. The anchor level is monthly-and-all-expiration sourced (+$90.7M monthly vanna at SPX 7,605 / ES 7,610, +$31.9M all-expiration gamma at SPX 7,600 / ES 7,605), so it survives Friday’s expiration and next week’s. Roll rather than close flat if the position is working into the monthly.
The trade. The stretch of negative dealer gamma below spot runs from SPX 7,700 / ES 7,705 down to SPX 7,600 / ES 7,605, and it ends where gamma flips positive: all-expiration gamma at SPX 7,600 / ES 7,605 is +$31.9M, sitting over $20.6B of net long dealer inventory. That is the pocket floor, and it is stacked with chart structure — the SPX 7,601 / ES 7,606 value-area high on it, the SPX 7,613 / ES 7,618 prior-week low and the SPX 7,628 / ES 7,633 value-area low just above. Buy the flush that reaches it and reclaims, not the shallow bounce on the way down. First half at SPX 7,605 / ES 7,610 into the floor itself, second half at SPX 7,618 / ES 7,623 once price has taken back the prior-week low. Entering at the floor is the whole point: it puts the stop underneath the negative-gamma stretch rather than inside it, which is where a shallow entry gets run.
Entry. SPX 7,605-7,618 / ES 7,610-7,623 Gate. Not live on the first touch. This leg arms only on a stall-and-reject — price trades into the zone and then closes back above SPX 7,605 / ES 7,610 on the day. Until that close lands the setup is not armed and there is no trade here.
Trigger — SPX 7,605 / ES 7,610 — reclaim of the gamma sign-flip after a flush into the floor zone
Add — SPX 7,618 / ES 7,623 — acceptance back above the prior-week low
Stop. SPX 7,575 / ES 7,580 — measured on a daily-close basis, so it takes a close beyond the level to invalidate it, not a touch. Risk. Stop 36.5 points below the entry midpoint — a little over half the roughly 65-point average daily range measured off the last fourteen daily sessions. On futures that is about $1,825 per ES contract at $50 a point. What actually places the stop is structure: it sits under the SPX 7,575 / ES 7,580 regime print, so the trade and this plan’s range read end together, and the range figure is context rather than a cap the board grounded. The stop assumes a 14 to 21 day option, which is the horizon the SPX 7,605 / ES 7,610 monthly vanna anchor lives in — do not put this stop distance on a short-dated option. Targets.
T1 SPX 7,660 / ES 7,665
T2 SPX 7,700 / ES 7,705 Reward-to-risk. ~1.8:1 to T1 (SPX 7,660 / ES 7,665), ~3.2:1 to T2 (SPX 7,700 / ES 7,705)
Option expression. SPXW 7,600/7,700 call debit spread (14-21).
Invalidation. A daily close below SPX 7,575 / ES 7,580 ends the trade and ends this plan’s range read at the same time.
Setup B — Pin-Band Continuation LONG at SPX 7,715-7,728 / ES 7,720-7,733 — Grade C
Time Horizon: MULTI-SESSION Carry Rule: Close by Friday unless the position is already through SPX 7,750 / ES 7,755. The anchor levels are one- and two-week sourced and thin out after next week’s expiration; carrying past that needs the SPX 7,775 / ES 7,780 monthly node underneath the position, not above it.
The trade. On the live ES clock price sits just under the one-day positive-gamma cluster that runs SPX 7,710-7,725 / ES 7,715-7,730, with the SPX 7,710 / ES 7,715 value-area high from the 8/31 week on it. Above that, SPX 7,725 / ES 7,730 is the first real brake — dealers hold short inventory there against positive gamma. Reclaiming the band and then clearing the brake is what turns this from a bounce into a leg. First half on the reclaim at SPX 7,715 / ES 7,720, second half at SPX 7,728 / ES 7,733 once the brake is cleared. This is a probe, not a primary — the shorter-timeframe regime has not settled, which is why it grades C and why the reclaim has to print before the trade exists at all.
Entry. SPX 7,715-7,728 / ES 7,720-7,733 Gate. Not live until a daily close above SPX 7,715 / ES 7,720 lands. Until that close, the setup is not armed.
Trigger — SPX 7,715 / ES 7,720 — reclaim and hold of the one-day pin band
Add — SPX 7,728 / ES 7,733 — the SPX 7,725 / ES 7,730 brake clears
Stop. SPX 7,696 / ES 7,701 Risk. Stop 25.5 points below the entry midpoint, which is roughly four-tenths of the ~65-point average daily range measured off the last fourteen daily sessions and about the ceiling for a one-to-three session hold. On futures that is about $1,275 per ES contract at $50 a point. The stop is placed at the SPX 7,696 / ES 7,701 shelf because that is the structure the continuation read dies on; the range figure informs it, it does not ground it. The stop assumes a 2 to 4 day option on the trigger leg. Targets.
T1 SPX 7,750 / ES 7,755
T2 SPX 7,775 / ES 7,780 Reward-to-risk. ~1.8:1 to T1 (SPX 7,750 / ES 7,755), ~3.2:1 to T2 (SPX 7,775 / ES 7,780)
Option expression. SPXW 7,725/7,775 call debit spread (2-4).
Invalidation. A loss of SPX 7,696 / ES 7,701 puts price back inside the negative-gamma stretch and the continuation read is wrong.
Setup C — Failed-Breakout Rejection SHORT at SPX 7,778-7,795 / ES 7,783-7,800 — Grade B
Time Horizon: MULTI-SESSION Carry Rule: Close by the end of the week. This is a countertrend probe inside a higher-timeframe uptrend, and carrying one of those past the week is how a good rejection becomes a bad position.
The trade. SPX 7,800 / ES 7,805 is the board’s peak concentration: all-expiration gamma +$84.4M over vanna +$605.1M, with the SPX 7,801 / ES 7,806 value-area high sitting on it. Positive gamma means dealers dampen, so a first touch tends to stall rather than break. This trade only exists if price pokes ABOVE that wall and then fails back under it — never a blind short into it. First half on the rejection at SPX 7,795 / ES 7,800, second half at SPX 7,778 / ES 7,783 if the SPX 7,770 / ES 7,775 point of control gives way. Targets are the SPX 7,750 / ES 7,755 pivot and then the SPX 7,725 / ES 7,730 brake.
Entry. SPX 7,778-7,795 / ES 7,783-7,800 Gate. Not live on the first touch. This leg arms only on a stall-and-reject — price trades into the zone and then closes back below SPX 7,800 / ES 7,805 on the day. Until that close lands the setup is not armed and there is no trade here.
Trigger — SPX 7,795 / ES 7,800 — rejection back under the SPX 7,800 / ES 7,805 wall after a poke above
Add — SPX 7,778 / ES 7,783 — the point-of-control shelf gives way
Stop. SPX 7,802 / ES 7,807 — measured on a daily-close basis, so it takes a close beyond the level to invalidate it, not a touch. Risk. Stop 15.5 points above the entry midpoint, roughly a quarter of the ~65-point average daily range measured off the last fourteen daily sessions. On futures that is about $775 per ES contract at $50 a point. The stop is placed on structure, two points above this plan’s own upside flip print, so a reclaim of the wall ends the trade and ends the range read together. The stop assumes a 3 to 5 day option on the trigger leg. Targets.
T1 SPX 7,750 / ES 7,755
T2 SPX 7,725 / ES 7,730 Reward-to-risk. ~6.4:1 to T1 (SPX 7,750 / ES 7,755), ~10.0:1 to T2 (SPX 7,725 / ES 7,730)
Option expression. SPXW 7,800/7,750 put debit spread (3-5).
Invalidation. A daily close back above SPX 7,802 / ES 7,807 — that is a reclaim of the wall and this plan flips trend-up.
Setup D — 0DTE Pin Reclaim LONG at SPX 7,696-7,706 / ES 7,701-7,711 — Grade C
Time Horizon: INTRADAY-ONLY Setup Type: Intraday (brakes / scalp) Carry Rule: Does not carry. The structure behind it expires with the Tuesday contract and does not exist on Wednesday.
The trade. The Tuesday expiration carries a positive-gamma cluster from SPX 7,710-7,725 / ES 7,715-7,730 with dealer-long inventory across it, and the one-day charm series crosses zero at SPX 7,717 / ES 7,722. That is the close magnet. Live price sits below it at SPX 7,702 / ES 7,707 — the ES clock, about 11 points under the Friday cash close the rest of this plan’s levels are struck against — inside the shelf that runs SPX 7,696-7,706 / ES 7,701-7,711. Buy the dip into that shelf for the rotation back up to the pin. Everything in this trade is inside about one straddle width of spot, which is the only radius a one-day option has any influence over. It does not carry overnight.
Entry. SPX 7,696-7,706 / ES 7,701-7,711
Trigger — SPX 7,706 / ES 7,711 — first touch of the shelf from above
Add — SPX 7,696 / ES 7,701 — deeper tag into the shelf base
Stop. SPX 7,692 / ES 7,697 Risk. On a one-day option the premium IS the stop. The price break sits 9 points below the entry midpoint, roughly a seventh of the ~65-point average daily range measured off the last fourteen daily sessions, which is about the ceiling for an intraday hold. On futures the equivalent is about $450 per ES contract at $50 a point. This assumes a 0DTE option — never put a swing-width stop on one. Targets.
T1 SPX 7,717 / ES 7,722
T2 SPX 7,725 / ES 7,730 Reward-to-risk. ~0.8:1 to T1 (SPX 7,717 / ES 7,722), ~1.4:1 to T2 (SPX 7,725 / ES 7,730)
Option expression. SPXW 9/08 7,700 call (0-0).
Invalidation. A loss of SPX 7,692 / ES 7,697 breaks the shelf and puts the negative-gamma stretch in charge; the pin read is wrong.
What Not to Do
Don’t trade the middle of the corridor as though it were a level — between the SPX 7,675 / ES 7,680 pivot and the fade zone’s lower edge there is no dealer structure worth pressing against, so wait for price to arrive at an edge and let that edge dictate the leg. Targets may sit inside that span; entries may not. This rule retires the moment a daily close above SPX 7,800 / ES 7,805 lands — from that close the range is over and it no longer applies.
Don’t carry the same conviction into Setup B and Setup D as into Setup A and Setup C: B and D are C-grade probes held back by an unsettled shorter-timeframe regime and a one-day clock, while A and C are B-grade and each gated on structure that has to prove itself before the trade exists.
Don’t chase Setup A on the way down — it is a reclaim of the SPX 7,600 / ES 7,605 flip, and buying the flush before it turns is how a good level becomes a bad entry. Same discipline on Setup C: no short until a poke above SPX 7,800 / ES 7,805 has actually failed back under it.
Quick Reference
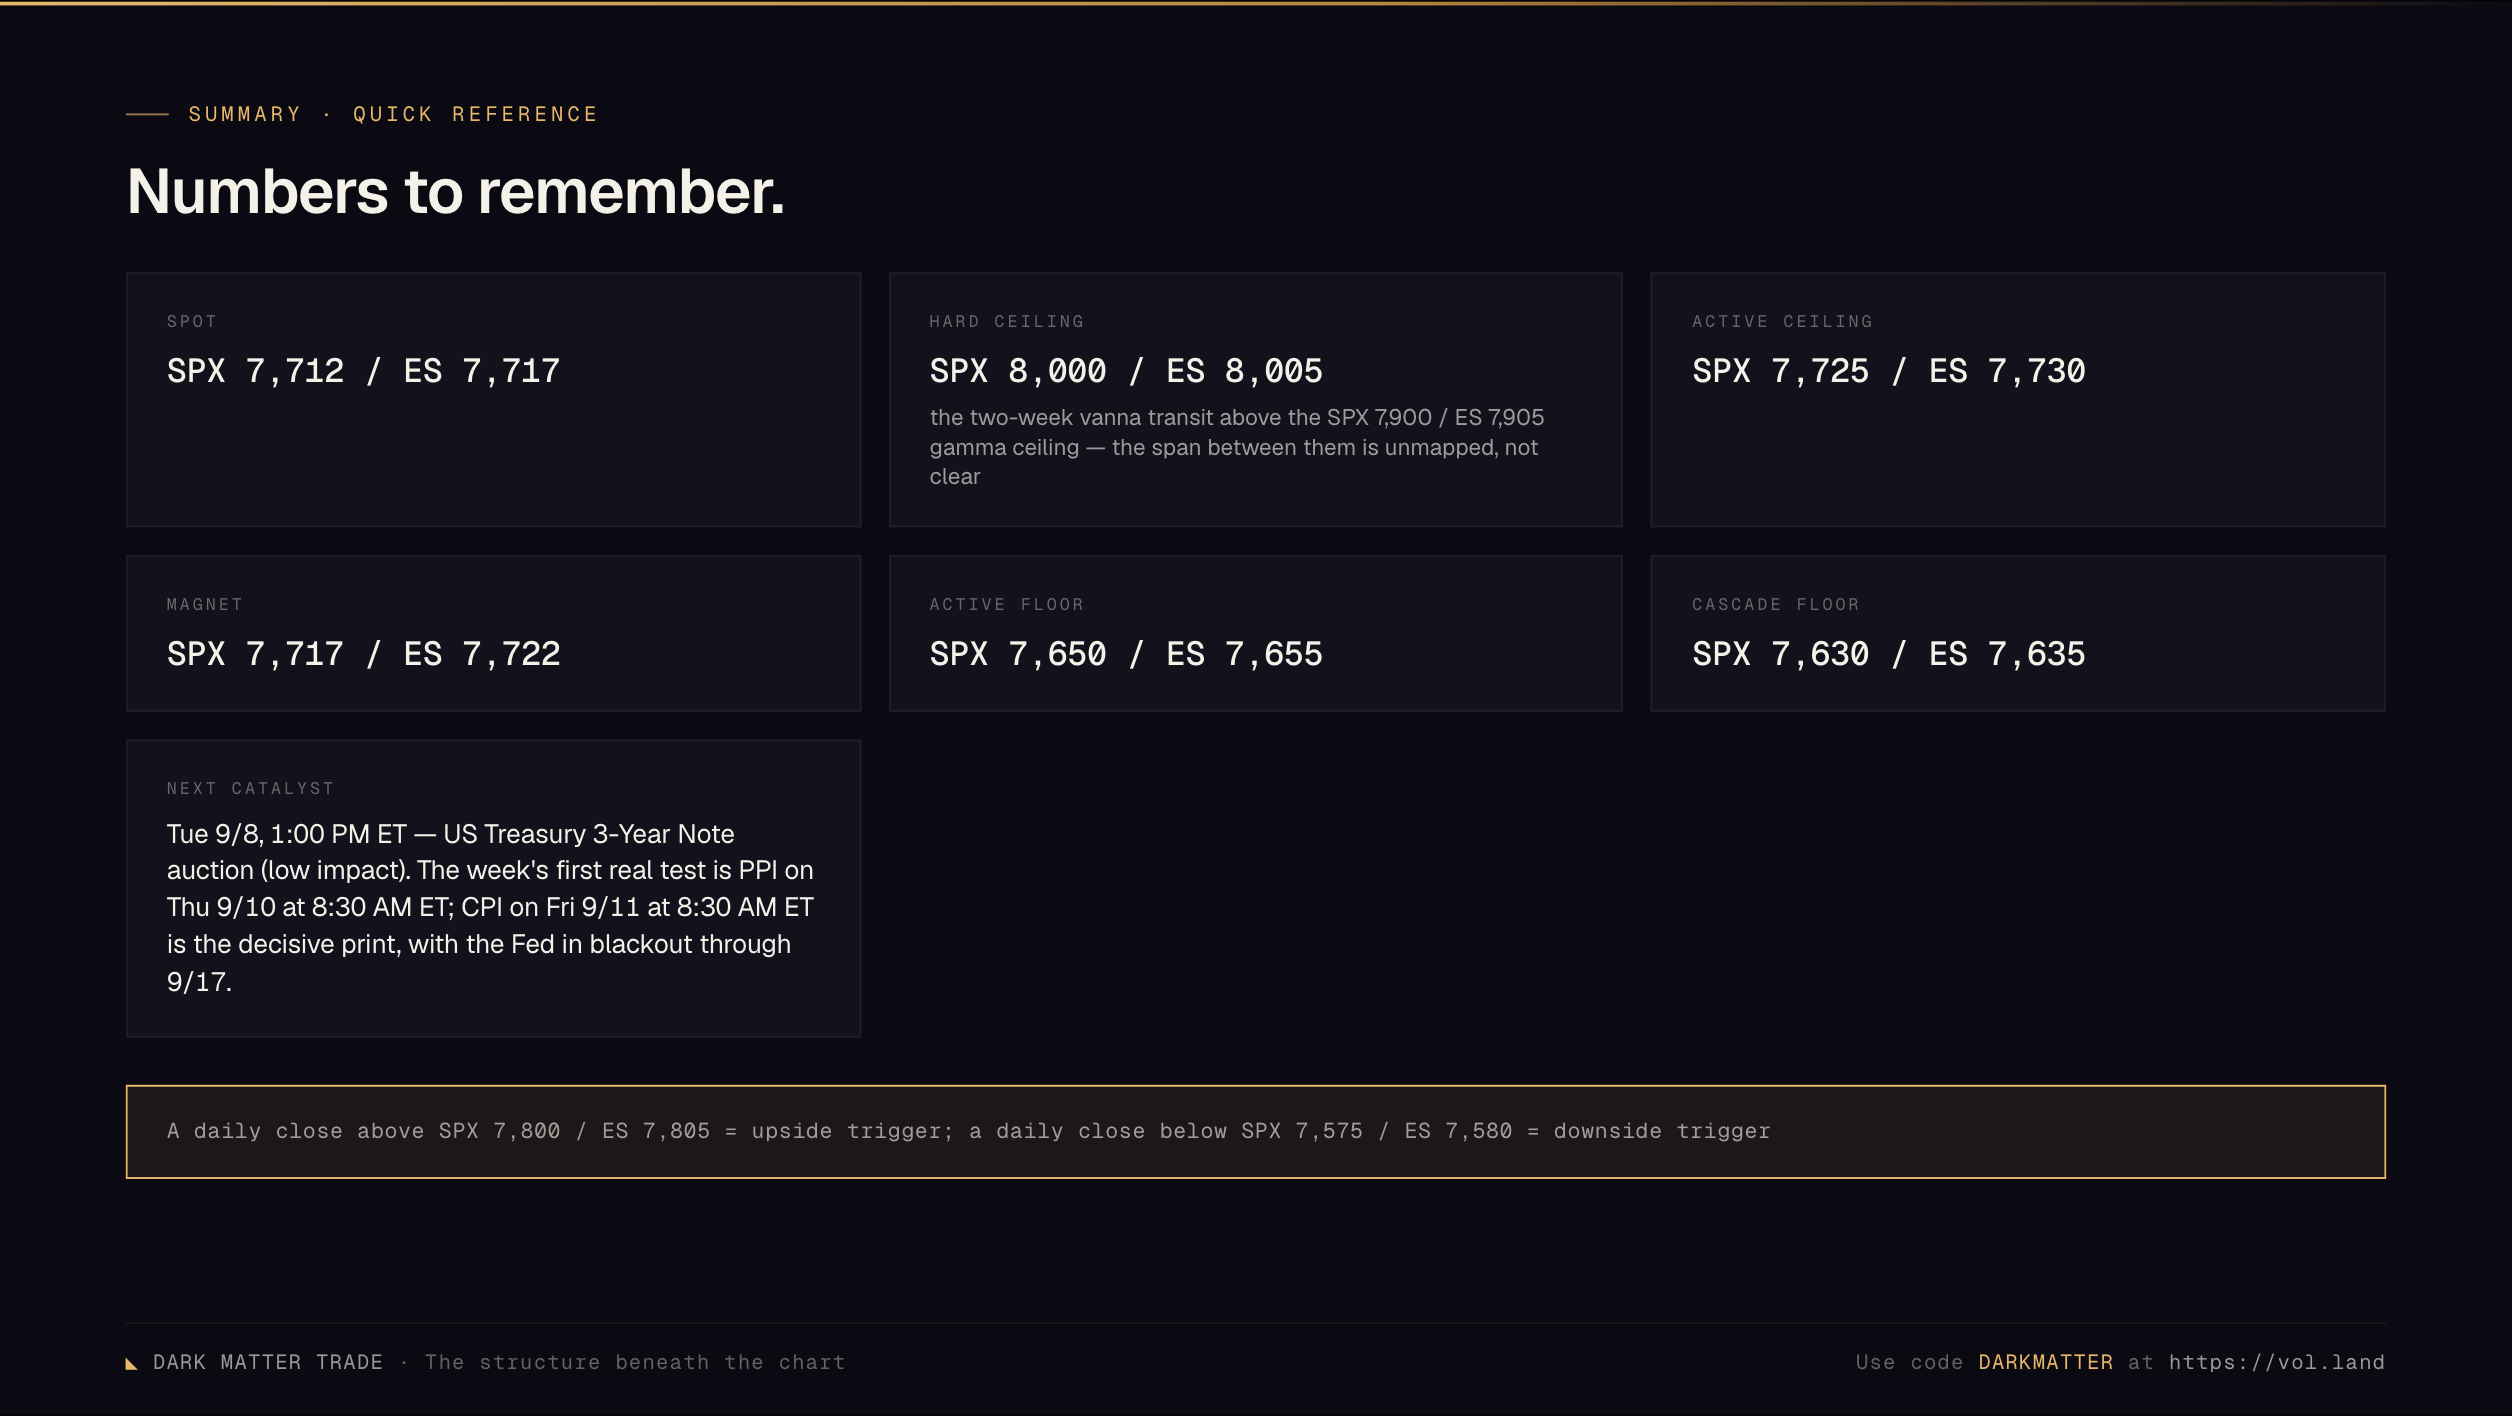
Spot: SPX 7,712 / ES 7,717
Today’s range expectation: About 65 points — the average daily range across the last fourteen completed sessions — roughly SPX 7,675-7,740 / ES 7,680-7,745 around spot, with the SPX 7,696 / ES 7,701 shelf as the first thing to give on the low side.
Hard ceiling: SPX 8,000 / ES 8,005 (the two-week vanna transit above the SPX 7,900 / ES 7,905 gamma ceiling — the span between them is unmapped, not clear)
Active ceiling: SPX 7,725 / ES 7,730
Magnet: SPX 7,717 / ES 7,722
Active floor: SPX 7,650 / ES 7,655
Cascade floor: SPX 7,630 / ES 7,635
Next macro catalyst: Tue 9/8, 1:00 PM ET — US Treasury 3-Year Note auction (low impact). The week’s first real test is PPI on Thu 9/10 at 8:30 AM ET; CPI on Fri 9/11 at 8:30 AM ET is the decisive print, with the Fed in blackout through 9/17.
Regime gate prints: A daily close above SPX 7,800 / ES 7,805 = upside trigger; a daily close below SPX 7,575 / ES 7,580 = downside trigger
Watch List
In the order it is likely to matter:
The 0DTE pin into Tuesday’s close — SPX 7,717 / ES 7,722. The 0DTE charm series crosses zero there, inside the positive-gamma cluster running SPX 7,710 / ES 7,715 to SPX 7,725 / ES 7,730. The tell is the last hour: price grinding back toward that band confirms the pin; price accepted below SPX 7,696 / ES 7,701 into the close says the pin lost and the negative-gamma stretch beneath is in charge.
SPX 7,725 / ES 7,730 — the brake. Positive gamma with dealers holding short inventory against it. Watch whether pushes into it stall or clear. A hold above is the cleanest upside tell on the plan.
SPX 7,696 / ES 7,701 — the shelf. The line between the range holding and the negative-gamma stretch running. Lose it and SPX 7,675 / ES 7,680, then SPX 7,650 / ES 7,655, arrive quickly.
SPX 7,800 / ES 7,805 — the wall. The only place a short is earned, and only on a poke above that closes back under. A daily close above it ends the corridor read.
Thu 9/10, 8:30 AM ET — PPI. The week’s first inflation print and the most likely single cause of vanna — the vol-driven magnet at SPX 7,800 / ES 7,805 — changing sign. Oracle and Adobe both report after that same close, which can re-weight near-spot structure overnight.
Fri 9/11, 8:30 AM ET — CPI. The decisive print, and with the Fed in blackout through 9/17 the only scheduled release left that can reprice the September decision.
The vol read itself. The spot-volatility gauge did not resolve this pull, so the vol-behaviour leg under every level above is unread. Watch for it to come back before leaning on any of these levels harder than the structure alone justifies.
Session Summary
This is a level-to-level week, not a directional one. Price comes into Tuesday on the lower half of the SPX 7,650 / ES 7,655 to SPX 7,790 / ES 7,795 corridor, with support layered close beneath at SPX 7,710 / ES 7,715, SPX 7,700 / ES 7,705, SPX 7,690 / ES 7,695 and SPX 7,685 / ES 7,690, and the first real brake overhead at SPX 7,725 / ES 7,730.
The two edges are where the money is. Below, a flush that reaches SPX 7,605 / ES 7,610 and reclaims it is buying where gamma turns positive over the board’s largest block of dealer inventory. Above, a push through SPX 7,800 / ES 7,805 that fails back under it is a fade at the heaviest node on the board. Everything else is transit between them.
In between, let price come to you. The band price is already working is dense enough that there is no open space to chase into — the level it reaches decides the next leg, not a forecast about which one it reaches first.
Know what ends the read. A daily close above SPX 7,800 / ES 7,805 or below SPX 7,575 / ES 7,580 retires the range and this plan follows the print, not the corridor.
Respect the calendar. Volatility is compressed at spot VIX 14.25 into PPI on Thursday, Oracle and Adobe after that session’s close, and CPI on Friday. A compressed surface into a repricing is what punishes a passive fade, so the back half of the week deserves a fresh look at the board rather than a carried assumption.