April 11, 2023 SPX, SPY, ES Trade Plan
Good evening/day/morning traders. Hope you enjoyed yesterday’s trade plan and were prepared for today’s reversal. Let’s get right into a recap of the trading session today.
Last session trading recap
From the trade plan we had two amazing trade ideas pan out. One for our futures trader where we chopped most of the overnight session and right at about 7am est we had some news broke triggering our first trade idea - remember the below levels are SPX - to get ES simply add 27pts or if the math is easier 30pts.
Below 4100 target 4080
When the regular trading session opened, SPX opened right at 4081. If you were trading ES this was your opportunity to close your trade and walk away with a nice 20pt gain - can’t get any better than a 20pt trade…
For our SPX and SPY traders right before the open I tweeted the following to iterate the selloff might be over…
Now I had tweeted to see how many of you understood how this was a failed breakdown? Let’s review in the below video…
Another successful trade plan and congrats to those who were able to take the failed breakdown!
I enjoy interacting and learning from other traders so continue to share your trades, ideas, and how you use this trade plan by messaging me on Twitter @DarkMatterTrade.
News Catalyst
1:30pm est - FOMC Member Goolsbee Speaks
For more information on news events, visit the Economic Calendar
SPX/ES/SPY Trade Plan
Remember you can use this SPX trade plan to trade ES or SPY. ES value is approx. 27-30pts more than the SPX levels shared below.
Bullish bias:
Above 4110 target 4135
If there is a failed breakdown of 4075 target 4100
Bearish bias:
Below 4100 target 4080
If there is a failed breakout of 4135-40 target 4115
SPX - The Why Behind the Plan
Key Levels
Below Spot:
4085-4070 - OB (1HR chart)
4075 - positive gamma and negative vanna
4078.29 - 4/3 weekly VAL & 1/30 weekly POC
4085.68 - January VAH
4070-4060 - FVG (1HR chart)
4060-4051 - FVG (2HR chart)
4045-55 - (403.63) - $6B has printed at this level
Above Spot:
4104-10 - (409.21 & 409.46) - Over $5.91B has been printed at this level
4109-4120 - FVG (2HR chart)
4105 - negative vanna
4121-4134 - OB (1HR chart)
4135-4148 - OB (2HR chart)
4135 - positive gamma
4136.08 & 4136.58 - February’s naked POC and 2/13 weekly naked POC
4140 - negative vanna
4145.38 - 2/13 weekly VAH
4145 - positive gamma
Dark Pool Levels
We need to pay attention to some key levels that have Dark Pool buildup. Mark them on your chart as key levels that we should pay attention to. Note I get my dark pool levels from Quant Data.
4122 - (410.99) - $1.51B printed at this level
We lost $1.5B in dark pool at this level
4104-10 - (409.21 & 409.46) - Over $5.91B has been printed at this level
This increased by another $2.4B on 4/10
4045-55 - (403.63) - $6B has printed at this level
3950-70 - (395.62) - Over $8B has been printed at this zone
3910-15 - (390.11) a key dark pool level that kept the market supportive
Here is a summary chart from Quant Data that shows the key levels that have been bought up in dark pool prints since the beginning of March 1, 2023. Remember the levels where we see dark pool prints greater than $2B should peak our interest.
Orderblocks (OB) and Fair Value Gaps (FVG)
These are smart money concepts and some areas I am looking to see how price reacts. I will give higher credence to OB’s whereas FVG’s could be areas of basing/consolidation if they break.
Resistance levels - at these levels I want to see if price rejects to short or consolidates for a push up. I couple this data with Volland, intraday option flows, and Dark Pool levels. Higher timeframe OB’s or FVG will be harder to break. OB’s are the stronger levels over FVG’s.
4109-4120 - FVG (2HR chart)
4121-4134 - OB (1HR chart)
4135-4148 - OB (2HR chart)
4153-4176 - OB (1HR chart)
4176-4200 - OB (2HR chart)
Support levels - at these levels I want to see if price rejects to long or consolidates for a push down. I couple this data with Volland, intraday option flows, and Dark Pool levels. Higher timeframe OB’s or FVG will be harder to break. OB’s are the stronger levels over FVG’s.
4095-4090 - FVG (1HR chart)
4085-4070 - OB (1HR chart)
4070-4060 - FVG (1HR chart)
4060-4051 - FVG (2HR chart)
4049-4035 - OB (2HR chart)
4018-4007 - OB (1HR chart)

Volume Profile
Let’s review the volume profile and some key levels there. If you are unfamiliar with the Volume Profile I highly suggest reviewing some YouTube videos or reading this quick overview on it.
Some keywords to be aware of:
VAH = value area high
VAL = value area low
POC = point of control
A naked POC means it hasn’t been tested after it was formed - these will typically act as magnets
No major changes to our volume profile levels. Would suggest you view the 4/10 plan below for details.
Weekly Option Expected Move
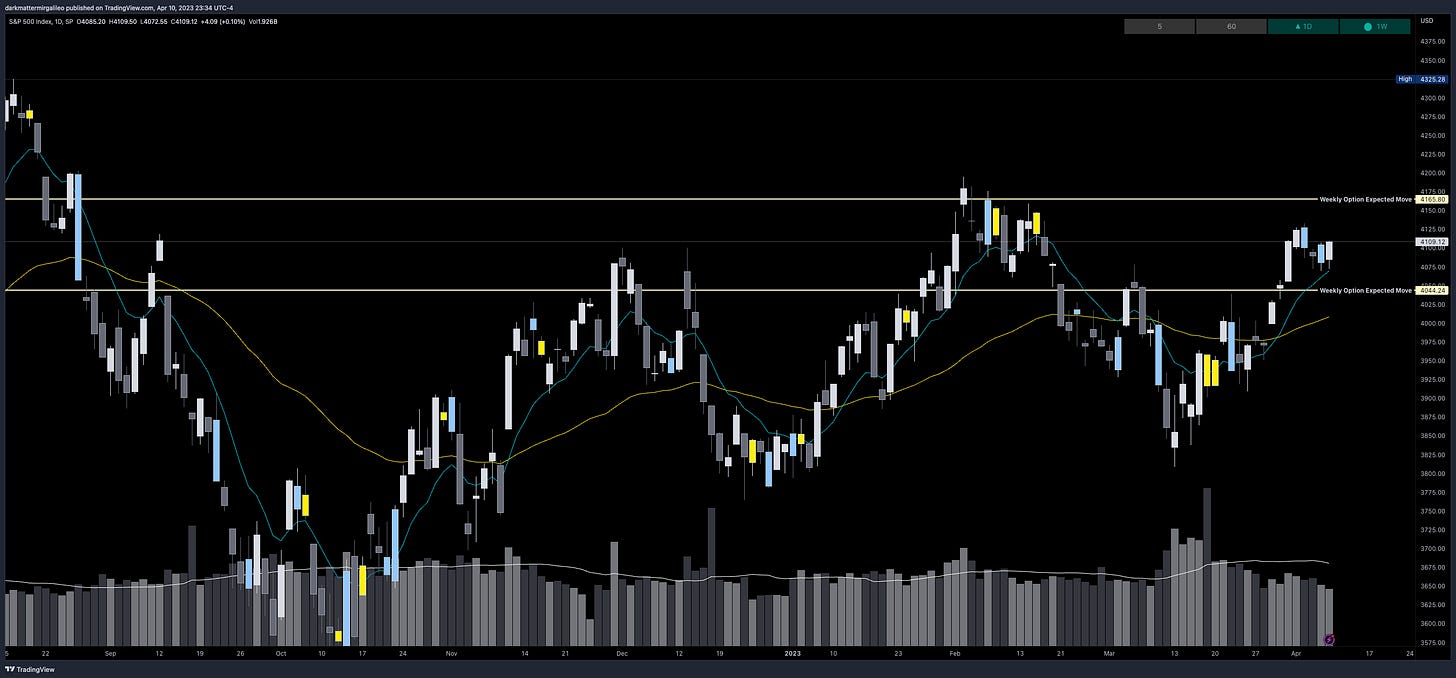
SPX’s weekly option expected move is ~60.78 points. SPY’s expected move is ~7.64. Remember over 68% of the time price will resolve it self in this range by weeks end.
VIX Update
Let’s review the VIX chart. The VIX finally broke above the downward trendline and tapped a high of 20.05 before selling off and setting a new low of day LOD prior to close.
Above Spot:
19.31-19.90
20.30-20.60
Below Spot:
18.95-18.51
17.32-16.92
16.04-15.44
15.44-14.95
Remember, typically VIX going down correlates with a uptrend in the market and vice versa for a downtrend in the market.
Vol.land Data
For a better understanding of the various greeks below I would suggest you visit the Volland YouTube Page. Volland provides unique data showing where dealers are positioned providing in my opinion a higher degree of conviction to where price may move to.
Vanna - Levels where price may repel or act as magnet
Remember for price to go above spot through a magnet or repellent VIX and IV must decrease or stay flat. For price to go below spot through a magnet or repellent VIX and IV must increase.
Positive vanna - will act as magnet
Negative vanna - will act as repellent
When price goes through a positive or negative level it will flip it - ie negative becomes positive and vice versa.
Above Spot:
4110 - negative vanna
4115-4135 - positive vanna
4140 - negative vanna
Below Spot:
4105 - negative vanna
4100-4080 - positive vanna
4075 - negative vanna
Gamma and Delta-Adjusted Gamma (DAG)
Positive Gamma Above Spot - acts as resistance
Positive Gamma Below Spot - acts as support
Above Spot:
4115-20 - positive gamma
4130-35 - positive gamma
4145 - positive gamma
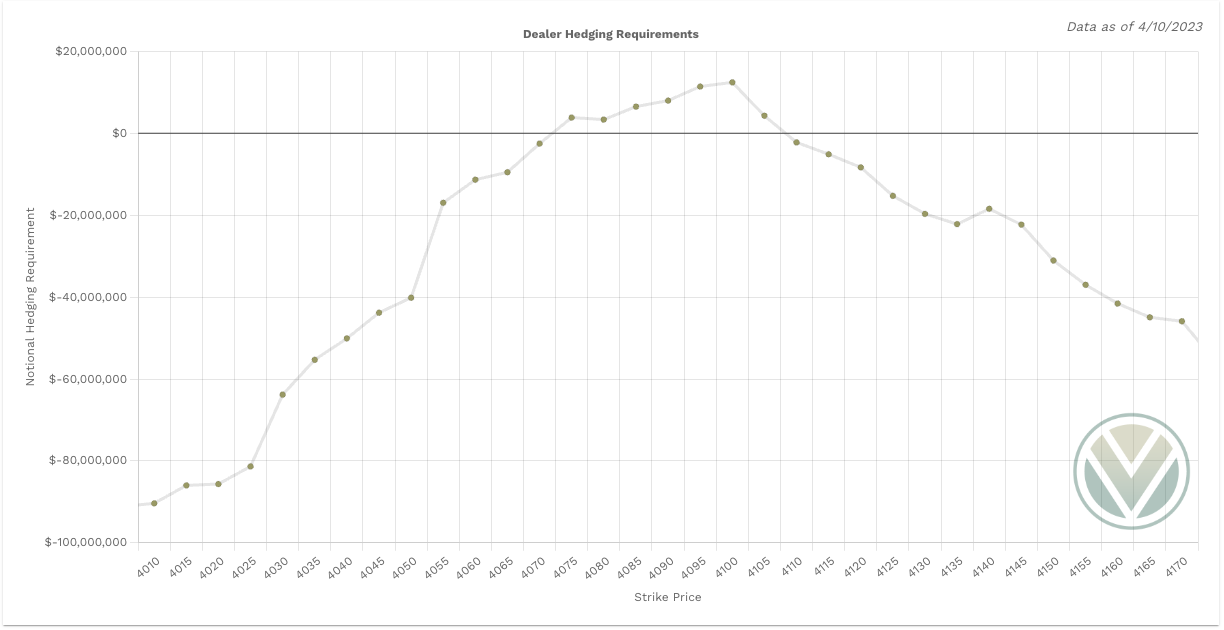
Dealers must buy between 4105-4075
Below Spot:
4100 - positive gamma
4075 - positive gamma
Dealers must sell all levels besides 4105-4075

Charm
Charm is negative on SPX. This suggests that Charm will have little a more bullish impact on SPX. Again this is an aggregate view of SPX - doesn’t guarantee 0DTE bullish bias.
When reviewing Charm we also need to account for SPY’s charm. It is leaning bearish.
Final Take
Today was a prime example of waiting and #paytiently taking a trade. If you waited until our half hour wait to trade zone you nailed the failed breakdown. Again have a plan and go into each trade knowing why you are trading it, what your plan and price target is, and where you will cut the trade if it goes against you…
Tomorrow I think we will continue to see a wide range trading and potentially some chop as the market awaits CPI on Wednesday.
I look forward to seeing you all in the morning. Stay #paytient and react to the key levels - no predictions! Good luck traders.
To cover our basis…
Welcome to my Substack where I provide a daily SPX trading plan to help guide my intraday trading. The purpose of this letter is not to advice you on your trading or investment decisions. I am simply documenting my daily trading plan for myself to help with planning and execution. These are simply my opinions and the data sourced from the likes of vol.land, TradingView, Quant Data and others. The stock market is risky, gains are not guaranteed. This is not about getting rich quick, but learn to educate yourself and make the necessary financial decisions on your own. This is not financial advice.


