August 7, 2023 SPX, SPY, ES Trade Plan
Last Week’s Review
Welcome back team - apologizes as I had some last minute travels and conflicts to attend to that kept me from providing the daily trade plans.
A bloody week indeed where the SPX lost 104 pts or down -2.27%. How I trade is based on data, whether that be Volland, dark pool levels, orderblocks, or historical market data, it helps me form a bias and how I should react. In last week’s trade plan we called out August’s seasonality and how there is a sharp quick selloff in August and low and behold we got that. Seasonality selloff check…Is more to come?
While my trades on ADBE and SPY puts did well, I took the bait on NVDA with the AMD ER as a catalyst and predicted instead of playing to a data based trade plan. While AMD went up and the trade looked positive the market instead reacted to macro news - this one from the new rating at Fitch.
I don’t think any of us predicted the change in ratings from Fitch and the market reacted negatively to it, selling off 60+ pts on Wednesday. This included a sharp selloff on AMD and NVDA as well.
So loss on the NVDA calls, but I managed the risk of the trade using profits from ADBE. Sounds simple, but it is. It is all about risk and how you manage it. If anyone tells you they nail every trade they are lying. On top of that I didn’t go in with the same sizing as I would normally do and I bought more time to decrease any potential losses if the trade went against me. Your goal is simply to keep your profits and reduce what you give back and then move on to the next trade. Hanging on to losers and hoping…will not make you a consistent and profitable trader. Follow the data…follow the trend…remove your emotions and bias. Good moment for us to remind us of this.
The major news event for this week is on Thursday when July’s CPI report is released. This is followed on Friday with PPI and Consumer Sentiment and Inflation Expectations. Additionally, China reports CPI Tuesday evening. Prior to all of that we have on Monday a few FED members speaking on Monday and on Wednesday I am paying attention to the 10-year Bond Auction.
The weekly expected move is larger than it was last week, which makes sense considering the large vol events we have this week.
With that let’s jump into the trade plan.
SPX/SPY/ES Overview (TL;DR)
Tough to be a bull at these levels and after last week. If you are you may want to scalp and take profits quick. Above 4480 target 4490. Above I want to see fresh data from Volland.
Bears want to stay below 4480 to target 4465. Below it 4440 then 4425.
There could be a chance we swing towards 4490 before selling off, but data shows a bearish day tomorrow.
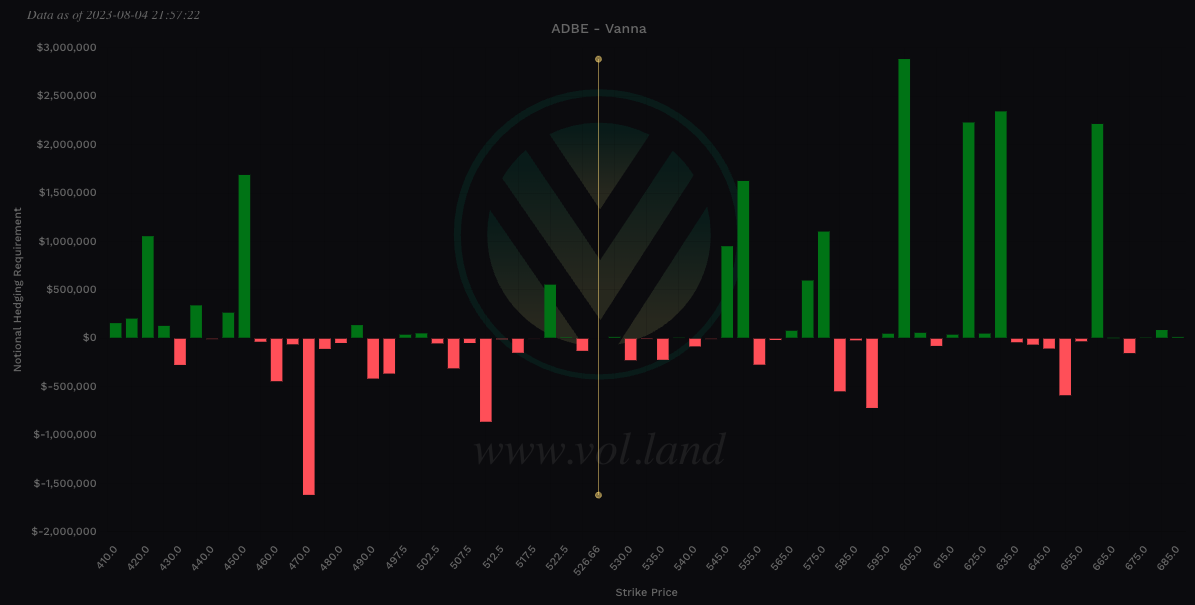
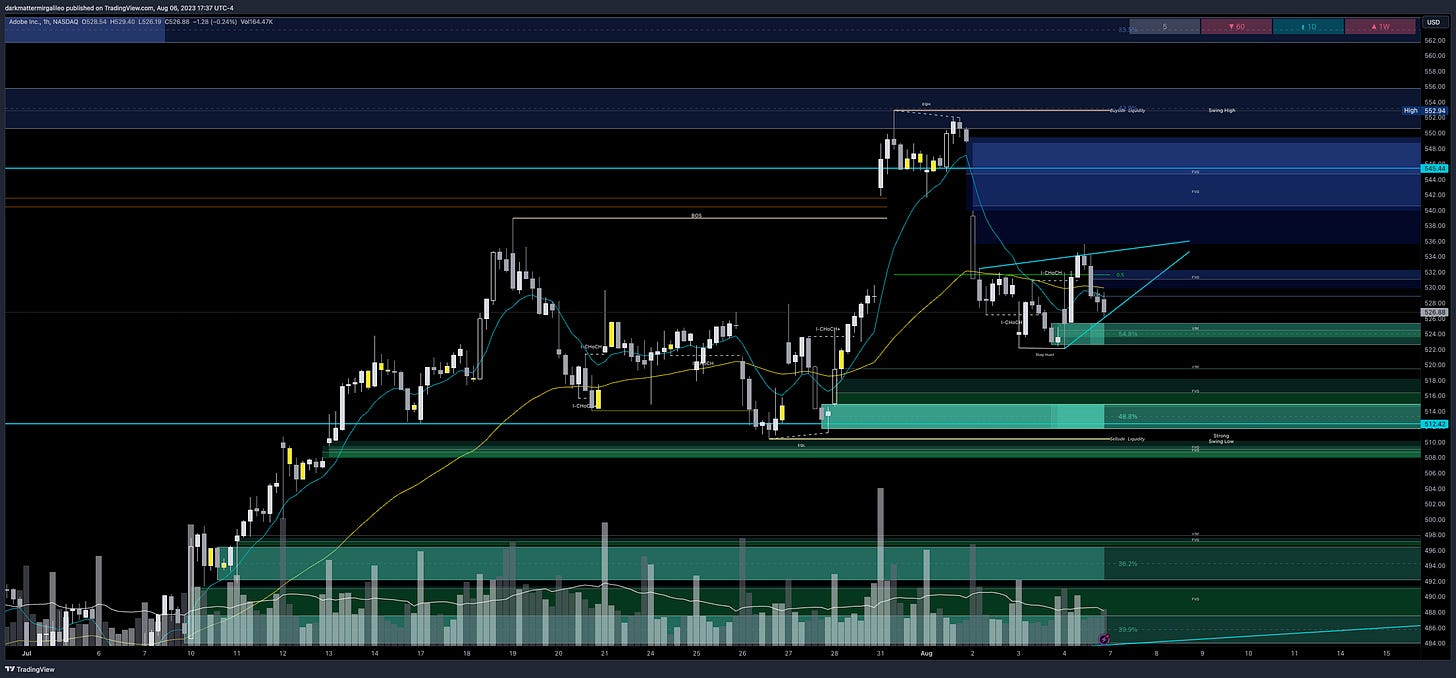
ADBE
525 and 530 could be areas of accumulation. If you are planning to go long I would consider 5 pts to scalp if 525 holds to target 530. Above 530 then 535, but high risk.
Instead I would rather wait for the break of 525 to target 517.5 then 515, which will provide the better R/R.
Below 525 target 517.5 then 515
If there is a failed breakout of 530 or 535 target 517.5 - 525 speed bump
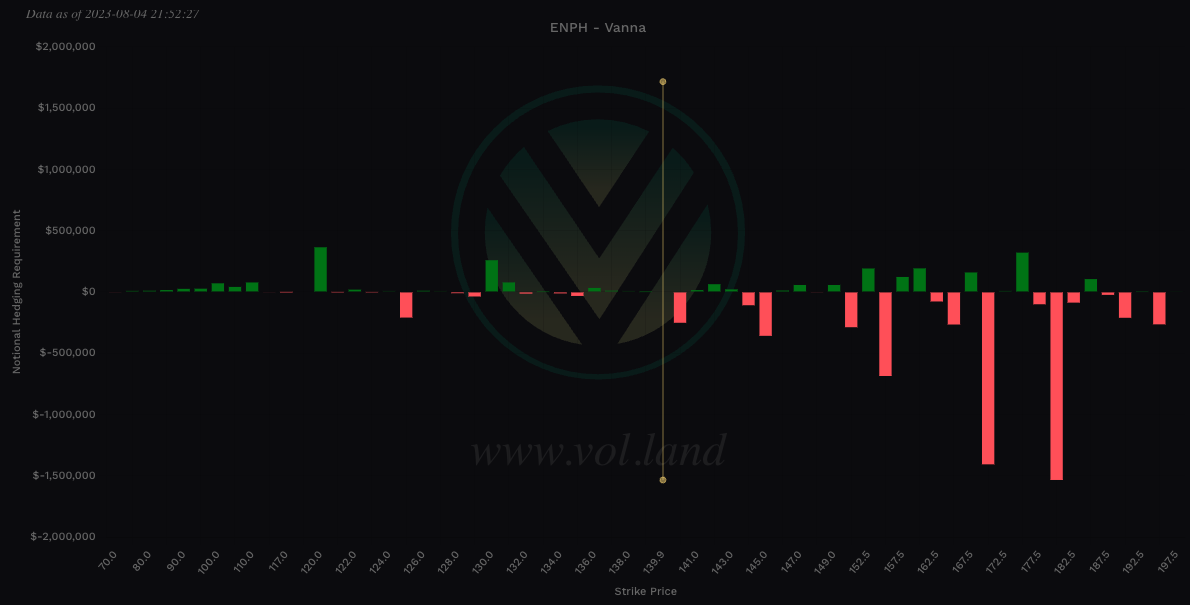
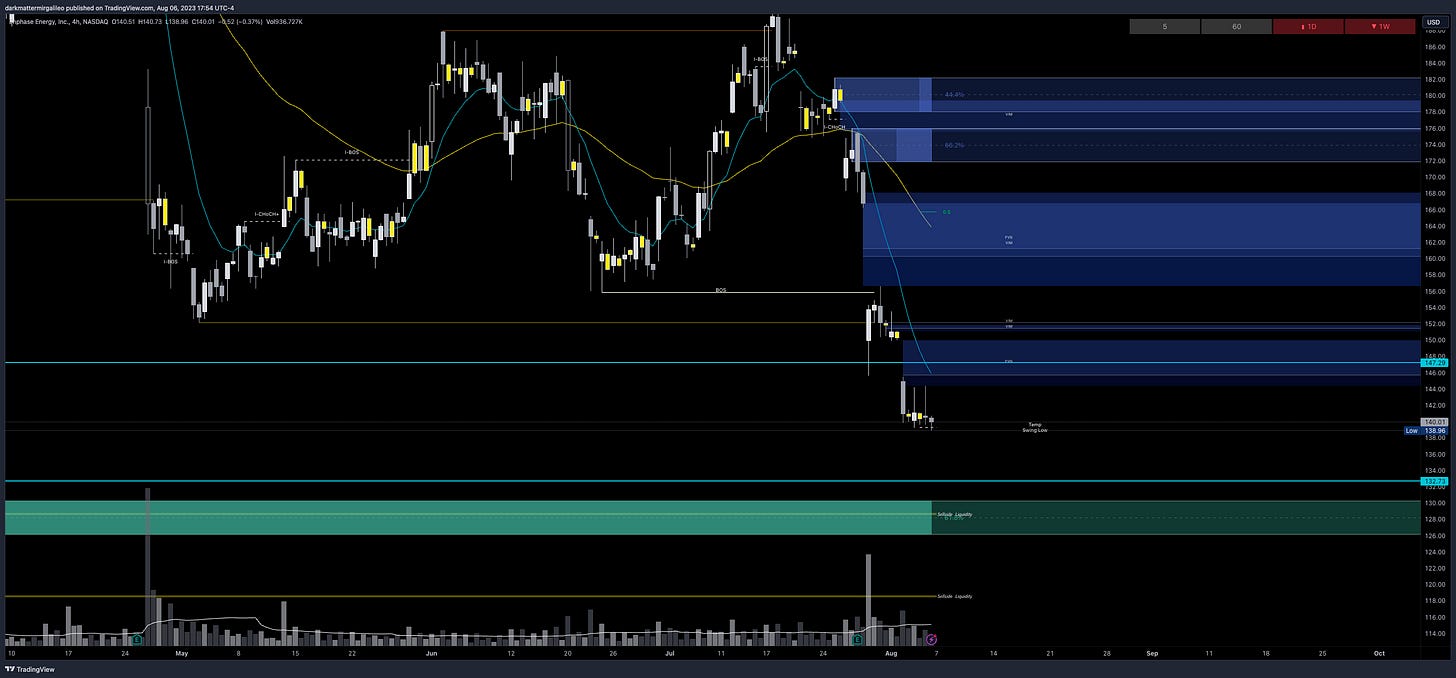
ENPH
140 is an extremely critical level. If it breaks we target 135. Above 140 target 144-145.
Below 140 target 135
Above 140 target 144-145
For intraday updates please follow me on Twitter @DarkMatterTrade.
News Catalyst
8:15am est - FOMC Member Harker Speaks
8:30am est - ISM Manufacturing Prices
3:00pm est - Consumer Credit m/m (while note market mover this is a data point I would keep an eye for)

For more information on news events, visit the Economic Calendar
8/7 - SPX/ES/SPY Trade Plan
Bullish bias:
Above 4480 target 4490
If there is a failed breakdown of 4575 target 4490
Bearish bias:
Below 4480 target 4465
If there is a breakdown of 4465 target 4440
If there is a breakdown of 4440 target 4425
As always keep an eye on Volland30, VOLD indicator, and the VIX for trend continuation or reversals.
Remember you can use this SPX trade plan to trade ES or SPY. ES value is approx. 20pts more than the SPX levels shared. To get SPY levels simply take the SPX levels and divide by 10.03.
SPX - The Why Behind the Plan
Key Levels
Above Spot:
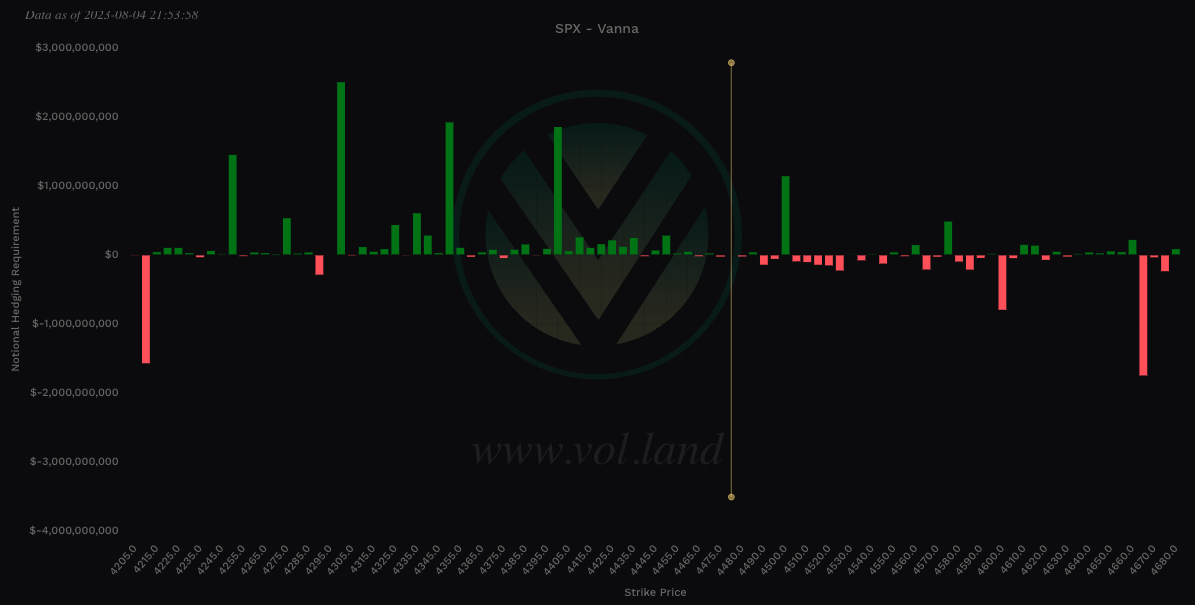
4480 - negative vanna - minor
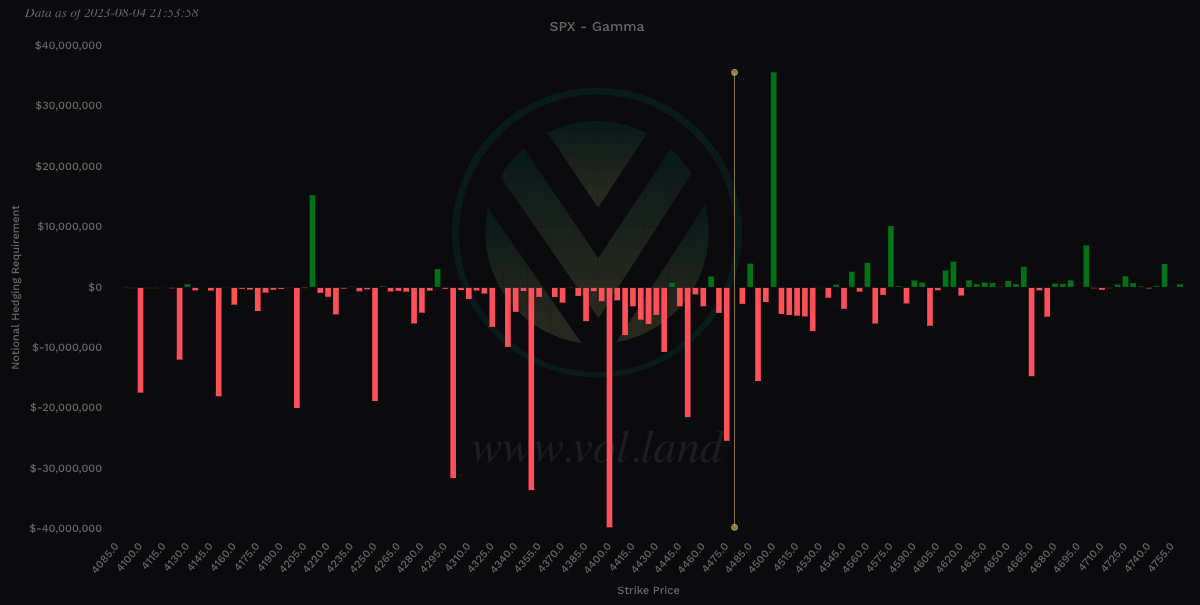
4485 - positive gamma
4490 - negative vanna
4495 - negative vanna
4500 - positive gamma
4505-4525 - negative vanna
4523-4536 - OB (1hr chart)
4529 midline
4503-4522 - 450.89-449.03 - $22.66B
4534-4540 - OB (30min chart)
4537 midline
4534-4538 - 452.49-452.14 - $15.81
4554-4567 - 455.41-454.08 - $19B
4572-4582 - OB (2hr, 4hr chart)
4577 midline
4577-4590 - 457.64-456.43 - $12.26B
Below Spot:
4475 - negative vanna - minor
4481-4465 - OB (1hr & 2hr chart)
4474 midline
4479-4471 - 446.65-445.79 - $7.32B
4465 - negative vanna
4465 - positive gamma
4440 - negative vanna - minor
4440 - positive gamma
4453-4444 - 444.02-443.15 - $8.93B
4425 - negative vanna
4425-4416 - OB (1hr chart)
4421 midline
4408-4399 - OB (2hr chart)
4404 midline
4410-4397 - 439.74-438.47 - $15.96B
4375 - negative vanna
4393-4380 - OB (1hr, 2hr chart)
4387 midline
Dark Pool Levels
We saw quite a bit of distribution on SPX over the past 9 days before we finally sold off on Wednesday. The market shred right through key levels at 4550 where $21B in dark pool sat previously and another $16B at 4535.
I have updated the snapshot of the key dark pool levels based off last week’s action and levels to keep an eye for if we continue to selloff. This is a snapshot of Dark Pool activity since July 3rd’s session.
Above Spot:
4503-4522 - 450.89-449.03 - $22.66B
4534-4538 - 452.49-452.14 - $15.81
4554-4567 - 455.41-454.08 - $19B
4577-4590 - 457.64-456.43 - $12.26B
Below Spot:
4479-4471 - 446.65-445.79 - $7.32B
4453-4444 - 444.02-443.15 - $8.93B
4438 - 442.52 - 6.46B
4410-4397 - 439.74-438.47 - $15.96B
I get my dark pool levels from Quant Data.
Orderblocks (OB) and Fair Value Gaps (FVG)
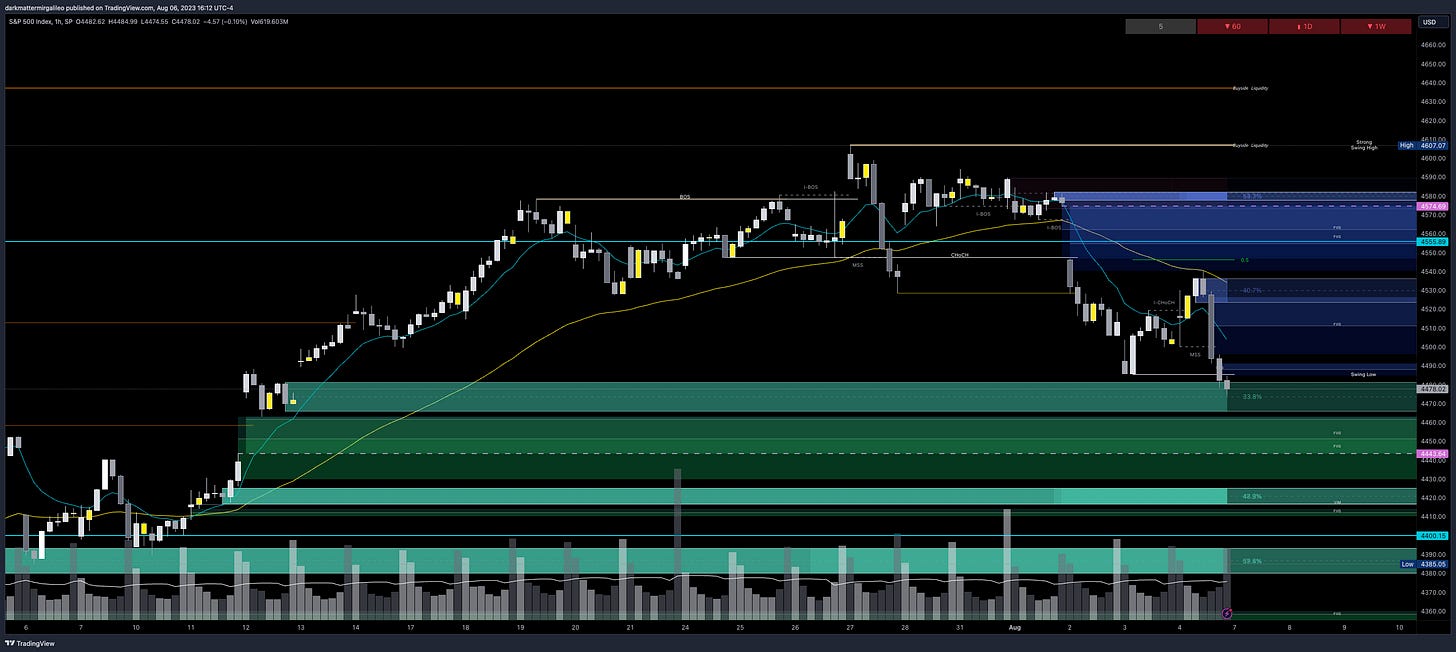
These are smart money concepts and some areas I am looking to see how price reacts. I will give higher credence to OB’s whereas FVG’s could be areas of basing/consolidation if they break. I use Sonarlab’s indicator on Tradingview to plot these.
Resistance levels - at these levels I want to see if price rejects to short or consolidates for a push up. I couple this data with Volland, intraday option flows, and Dark Pool levels. Higher timeframe OB’s or FVG will be harder to break. OB’s are the stronger levels over FVG’s.
4523-4536 - OB (1hr chart)
4529 midline
4534-4540 - OB (30min chart)
4537 midline
4572-4582 - OB (2hr, 4hr chart)
4577 midline
4638-4660 - FVG (4hr chart)
4652-4665 - OB (1hr, 2hr chart)
4658 midline
Support levels - at these levels I want to see if price rejects to long or consolidates for a push down. I couple this data with Volland, intraday option flows, and Dark Pool levels. Higher timeframe OB’s or FVG will be harder to break. OB’s are the stronger levels over FVG’s.
4481-4465 - OB (1hr & 2hr chart)
4474 midline
4425-4416 - OB (1hr chart)
4421 midline
4408-4399 - OB (2hr chart)
4404 midline
4393-4380 - OB (1hr, 2hr chart)
4387 midline
4344-4328 - OB (2hr chart)
4336 midline
Weekly Option Expected Move
SPX’s weekly option expected move is ~77.87 points. SPY’s expected move is ~7.86. That puts us at 4555.89 to the upside and 4400.15 to the downside. For SPY these levels are 454.67 and 438.95.
Remember over 68% of the time price will resolve it self in this range by weeks end.
Volland Data
For a better understanding of the various greeks below I would suggest you visit the Volland YouTube Page. Volland provides unique data showing where dealers are positioned providing in my opinion a higher degree of conviction to where price may move to.
Vanna - Levels where price may repel or act as magnet
Remember for price to go above spot through a magnet or repellent VIX and IV must decrease or stay flat. For price to go below spot through a magnet or repellent VIX and IV must increase.
Positive vanna - will act as magnet
Negative vanna - will act as repellent
When price goes through a positive or negative level it will flip it - ie negative becomes positive and vice versa.
Above Spot:
4480 - negative vanna - minor
4490 - negative vanna
4495 - negative vanna
4505-4525 - negative vanna
Below Spot:
4475 - negative vanna - minor
4465 - negative vanna
4440 - negative vanna - minor
4425 - negative vanna
4375 - negative vanna
4360 - negative vanna
Gamma
Positive Gamma Above Spot - acts as resistance - meaning that dealers want to push against the move
Positive Gamma Below Spot - acts as support - meaning that dealers will want to support price at these levels
Negative Gamma - becomes permissive to price as it moves there - aka neither resistance nor support - simply just chillin and watching what’s happening…
Above Spot:
4485 - positive gamma
4500 - positive gamma
Below Spot:
4465 - positive gamma
4440 - positive gamma
Charm
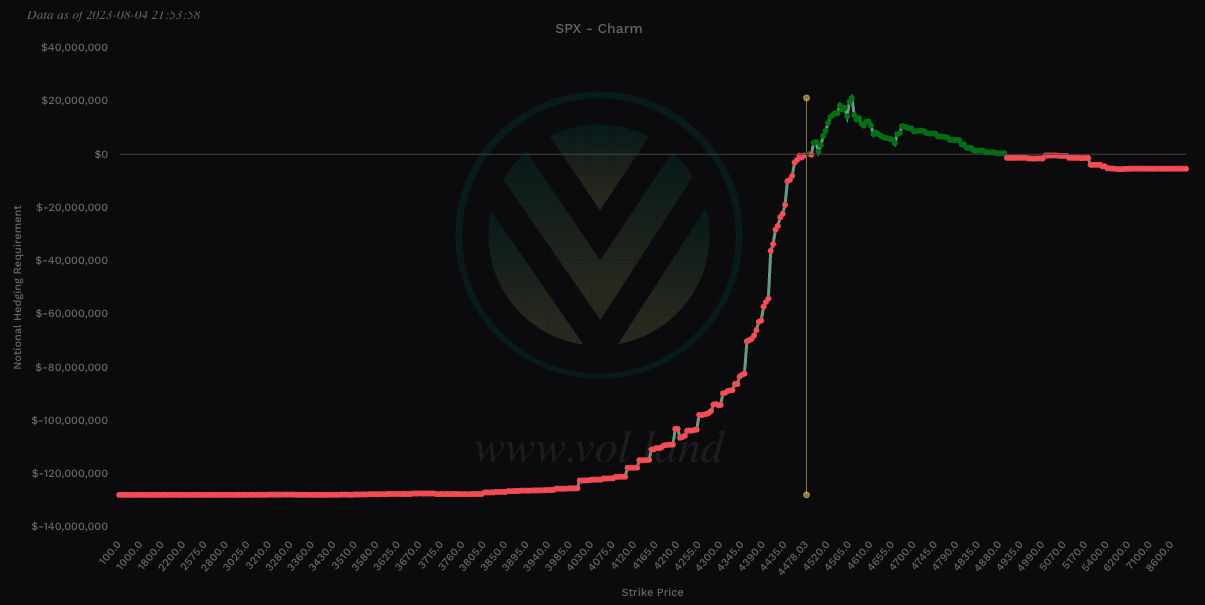
Remember if IV is not expanding Charm will start to overtake Vanna especially 0DTE as it comes closer to expiration.
For all expiry’s, Charm total notional value is bullish - negative is bullish and positive bearish - take the total of the far left and far right values. This is a longer term view of the market and suggests we find key dips to buy to long.
To cover our basis…
Welcome to my Substack where I provide a daily SPX trading plan to help guide my intraday trading. The purpose of this letter is not to advice you on your trading or investment decisions. I am simply documenting my daily trading plan for myself to help with planning and execution. These are simply my opinions and the data sourced from the likes of vol.land, TradingView, Quant Data and others. The stock market is risky, gains are not guaranteed. This is not about getting rich quick, but learn to educate yourself and make the necessary financial decisions on your own. This is not financial advice.


