December 21, 2023 SPX, SPY, ES Trade Plan
Market Recap
So what the heck happened today? Let’s get some assumptions out of the way…
Were we overbought? Heck yes. Does that mean markets will sell? No it doesn’t, but retracements/selloffs are good for markets to continue up
Was volume low? Yes.
Was there liquidity zones that if breached would push us one way or the other? Yes, you clearly saw those today as we sold off - cough 4765 and 4750 cough…
What occurred today was a trader found a hole and hammered 0DTE puts which began the markets selloff, but what pushed it over the cliff was that as we ripped past 4765 this began the selloff for dealers who exacerbated the selloff.
There was no news. There was no macro change. All-in-all this is why we play by the levels. As we broke 4765 it went to 4750 and the minute we broke 4735 we just zipped right through it to hit 4720. It wasn’t until 4720 where we had some bids to hold price, but it too couldn’t hold the selloff and we ripped right through to target the last vanna level at 4700.
We had mentioned in the chat room before the selloff that the moment 4765 is gone it is bad. Won’t be good for the market and along with it to watch the VIX. During the time we were consolidating near the highs I sent a message in the chat room that along with 4765 getting lost and if the VIX goes above 12.74 could produce a larger selloff. Both happened almost right at the same time and the rest is history. Congrats to those who took part - I cut my calls that I had planned to swing at around 4750 - couldn’t find a bid at 4765. These things happen, but I knew my risk and was playing with profits.
In summary one of the interesting parts of today was that the charm profile was showing a gex profile even as the selloff began. What we should have picked up on was the change to the 0DTE gamma chart. It was interesting to see that prior to 2pm all the updates had a green gamma level below support - indicating support. By about 2 pm this profile was starting to change and by 2:30pm we were below a red gamma level - 4570 - with the large red bar at 4765 looming. This should have been a leading indicator for us to have cut any longs and at least go flat, if not enter into shorts.
Let’s review the greeks over time in yesterday’s session…
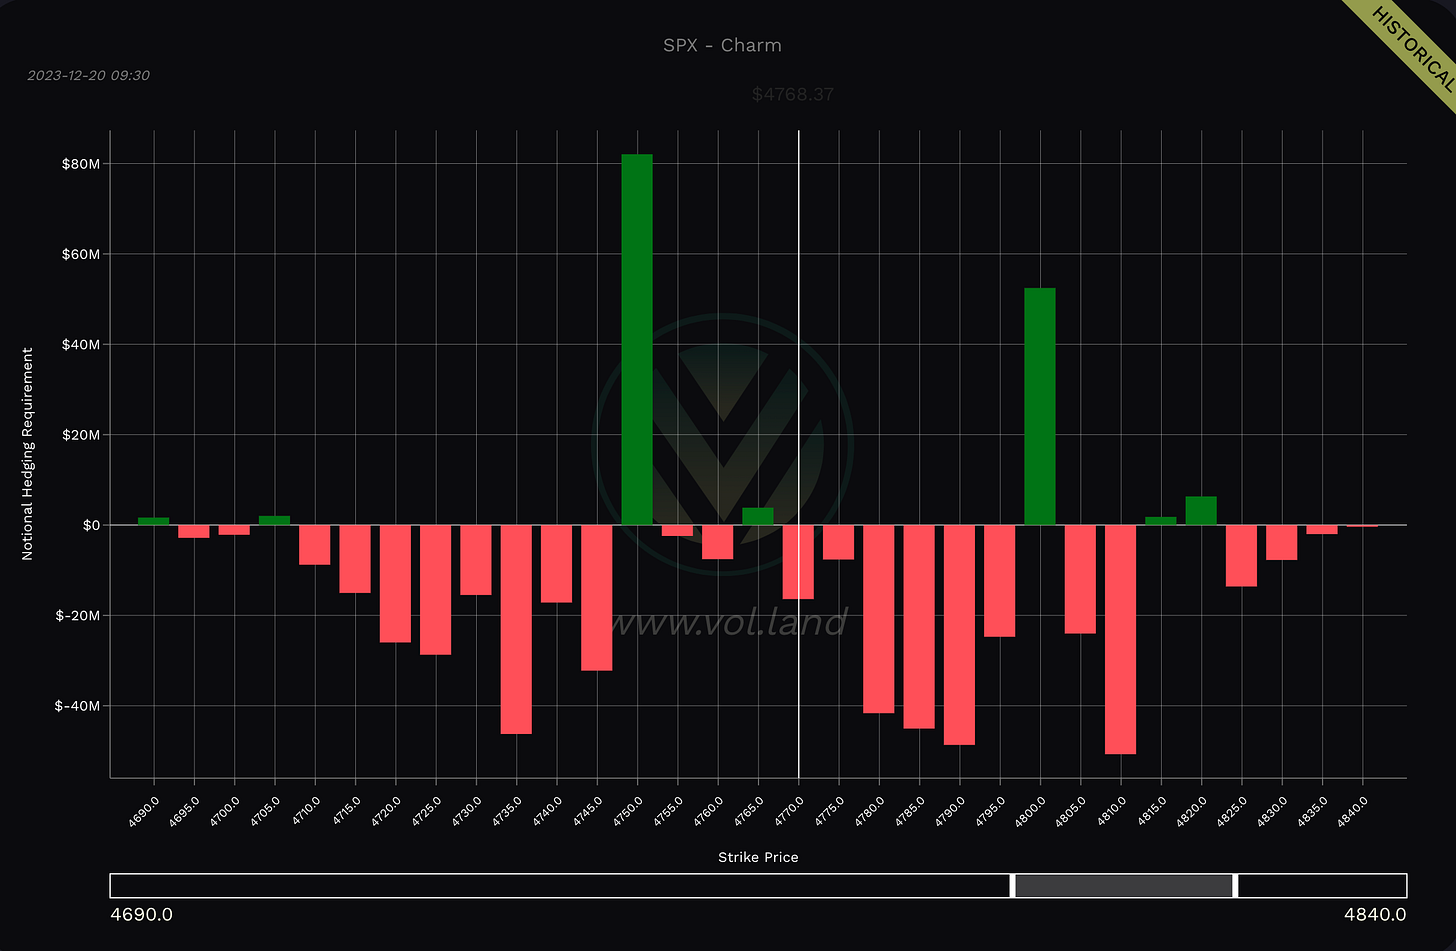
Here is our 9:30am update for Gamma and Charm. On the Gamma chart you will see that 4750 is our LIS - that goes and all those red bars we will start to sell through. On the charm chart similar story - 4750 is our LIS - with 4795 as target.
Now let’s forward in time to about 1:00 pm for a view of gamma and charm. Both have 4765 as their LIS, but things are still looking good for a target to 4790 if not 4795.
Now from 1:30pm and when that selloff occurred charm was continuing to show a similar bullish outlook as above - a GEX paradigm. Instead let’s now look at gamma. Here at 1:30pm you can clearly see now price is within one of the red bars and we are coming to a key LIS - a LIS we mentioned in the chat - 4765…
The 2 pm update had a similar charm and gamma flow to it. Then at 2:30pm you start to see more levels in red and even 4780 above spot turned red as well.
We then had a similar update at 3 pm where we found some green bars below spot on Gamma, but by the 3:30pm update they too had turned red with 4705 or 4695 as the final resting spot.
Here is a view of charm at the 3pm update…
It is during these extremely volatile moments where having Volland Live to track dealer positioning becomes critical. Within those 30min windows a lot can change as you can see and I am sure if we had Volland Live during this time we would have seen the morphing of the charm and gamma profile.
Lesson learned here and will add to our arsenal going forward to keep tabs on both gamma and charm as the day goes especially when we are in a GEX paradigm. With that said, let’s jump into the trade plan.
For those who haven’t subscribed this is a great opportunity to subscribe.
For as little as $15/month we provide daily trade plans for intraday traders and also provide great educational content.
News Catalysts
8:30am est - GDP
8:30am est - Final GDP Price Index q/q
8:30am est - Unemployment Claims
8:30am est - Philly Fed Manufacturing Index
8:30am est - Retail Sales
For more information on news events, visit the Economic Calendar
12/21 - SPX/ES/SPY Trade Plan
Bullish bias:
Above 4705 target 4740-4745
Expect some bumps around 4715 and 4725-4730
If VIX continues going down then a breakout of 4745 targets 4760-4765
A breakout of 4765 will target 4775
I would be careful with longs above 4775 and when reaching this zone - will review updated options flow data in the chat room
Bearish bias:
If there is a failed breakout of 4740 target 4725
Below 4725 target 4705
If VIX continues going up then a breakdown of 4705 targets 4690
A breakdown of 4690 will target 4670
Check in for updated options flow data in the chat room for this trade idea
As always keep an eye on Volland30 and the VIX for trend continuation or reversals.
Remember you can use this SPX trade plan to trade ES or SPY. ES value is approx. 51pts more than the SPX levels shared. To get SPY levels simply take the SPX levels and divide by 10.01.
SPX - The Why Behind the Plan
Volume Profile & Trends
Let’s review our volume profiles…
From a quarterly volume profile on the weekly chart some key levels are seen.
4778 - Q4 VAH - still forming
4698 - Q4 2021 POC
4687 - 2021 POC
4552 - Q4 POC - still forming
4532 - 2023 VAH
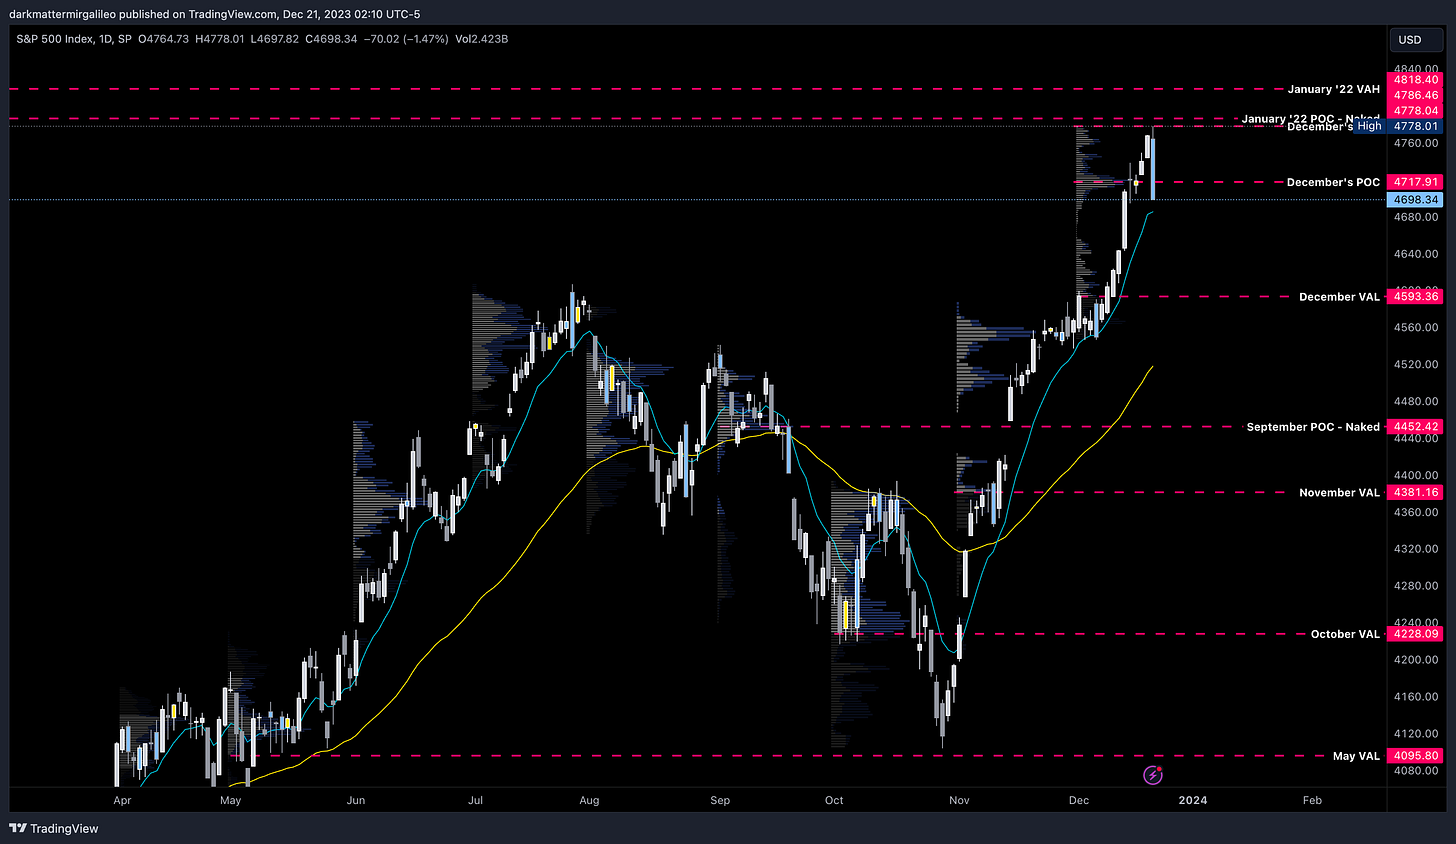
If we take a look at the daily chart and review the monthly volume profile we find the following levels…
4818 - January ‘22 VAH
4786 - January ‘22 POC - hasn’t been breached
4778 - December's VAH - still forming
4717 - December's POC - still forming
4593 - December’s VAL - still forming
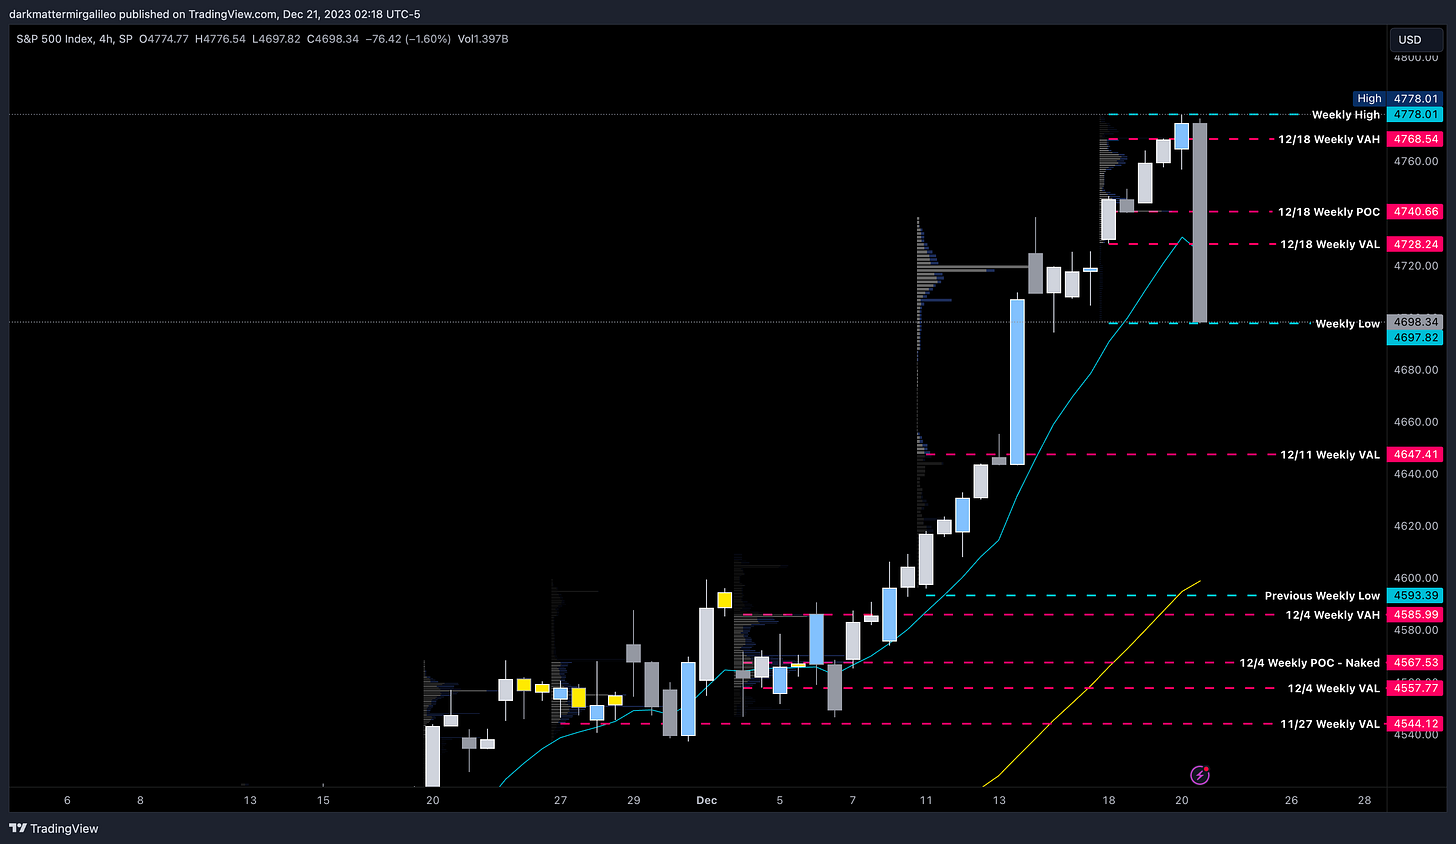
Let’s now look at the 4hr chart and review what the weekly volume profile levels show.
4778 - Weekly High
4768 - 12/18 Weekly VAH (still forming)
4740 - 12/18 Weekly POC - still forming
4728 - 12/18 Weekly VAL - still forming
4647 - 12/11 Weekly VAL
On the smaller timeframe and intraday let’s go to our 30min chart where we will put our session volume profile on. Our levels of importance are…
4770 - 12/20 VAH
4698 - 12/20 VAL
4651 - 12/13 VAL
4628 - 12/12 VAL
4607 - 12/11 VAL
4592 - 12/8 VAL
Volland Data
For a better understanding of the various greeks below I would suggest you visit the Volland YouTube Page. Volland provides unique data showing where dealers are positioned providing in my opinion a higher degree of conviction to where price may move to.
Vanna - Levels where price may repel or act as magnet
Remember for price to go above spot through a magnet or repellent VIX and IV must decrease or stay flat. For price to go below spot through a magnet or repellent VIX and IV must increase.
Positive vanna - will act as magnet
Negative vanna - will act as repellent
When price goes through a positive or negative level it will flip it - ie negative becomes positive and vice versa.
Above Spot:
4705 - negative vanna
4740-4745 - negative vanna
4755-4765 - negative vanna
4775-4795 - negative vanna
4820 - negative vanna
Below Spot:
4690 - negative vanna
4670 - negative vanna
4650-4645 - negative vanna
4635-4630 - negative vanna
4615 - negative vanna
4600-4595 - negative vanna
Orderblocks (OB)
Resistance levels - at these levels I want to see if price rejects to short or consolidates for a push up. I couple this data with Volland, intraday option flows, and Dark Pool levels. Higher timeframe OB’s or FVG will be harder to break. OB’s are the stronger levels over FVG’s.
4770-4778 - OB (30min, 1hr chart)
4774 midline
4778-4797 - OB (1hr, 2hr chart)
4788 midline
Support levels - at these levels I want to see if price rejects to long or consolidates for a push down. I couple this data with Volland, intraday option flows, and Dark Pool levels. Higher timeframe OB’s or FVG will be harder to break. OB’s are the stronger levels over FVG’s.
4652-4643 - OB (1hr, 2hr chart)
4648 midline
4590-4546 - OB (1D chart)
4568 midline
4568-4546 - OB (4hr chart)
4556 midline

Key Levels
Above Spot:
4705 - negative vanna
4717 - December's POC - still forming
4728 - 12/18 Weekly VAL - still forming
4740-4745 - negative vanna
4740 - 12/18 Weekly POC - still forming
4755-4765 - negative vanna
4768 - 12/18 Weekly VAH (still forming)
4770 - 12/20 VAH
4770-4778 - OB (30min, 1hr chart)
4774 midline
4775-4795 - negative vanna
4778-4797 - OB (1hr, 2hr chart)
4788 midline
4778 - Weekly High
4778 - December's VAH - still forming
4778 - Q4 VAH - still forming
4786 - January ‘22 POC - hasn’t been breached
Below Spot:
4690 - negative vanna
4687 - 2021 POC
4670 - negative vanna
4650-4645 - negative vanna
4652-4643 - OB (1hr, 2hr chart)
4648 midline
4651 - 12/13 VAL
4647 - 12/11 Weekly VAL
4635-4630 - negative vanna
4628 - 12/12 VAL
4615 - negative vanna
4607 - 12/11 VAL
4600-4595 - negative vanna
4593 - December’s VAL - still forming
4592 - 12/8 VAL
Weekly Option Expected Move
SPX’s weekly option expected move is ~54.53 points. SPY’s expected move is ~5.61. That puts us at 4773.71 to the upside and 4664.65 to the downside. For SPY these levels are 474.98 and 463.76.
Remember over 68% of the time price will resolve it self in this range by weeks end.
TradingView Chart Access
For access to my chart laying out all of the above key levels please visit here.
To cover our basis…
Welcome to my Substack where I provide a daily SPX trading plan to help guide my intraday trading. The purpose of this letter is not to advice you on your trading or investment decisions. I am simply documenting my daily trading plan for myself to help with planning and execution. These are simply my opinions and the data sourced from the likes of vol.land, TradingView, Quant Data and others. The stock market is risky, gains are not guaranteed. This is not about getting rich quick, but learn to educate yourself and make the necessary financial decisions on your own. This is not financial advice.


