February 26, 2024 SPX, ES, SPY Trade Plan
Weekly Market Overview
2021…This market is shaping itself to move very similarly like it did in 2021. Dips are found to continue a push up. I mentioned this in last week’s trade plan that this market is starting to behave like 2021. There was a low in February it found and then a higher low in March and off it went…
In the below 2021 weekly chart of the SPX you can clearly see this “buy the dip” strategy and any opportunities where price came below the 10ema, buyers came in strong pushing price back above that EMA before that weeks candle close…The lone exception to this around that very weak period of September/October.
Now compare that to the 2024 market…We have been more bullish than 2021 has been and instead we are more closely tracking with the 5sma. We have yet to have a reversion to any other SMA since this rally began in October. Incredible…
Transition to Discord - Next Steps
If you have not had the chance to subscribe to our new Discord please visit us and get a 5 day free trial! We will be shutting the doors here on the Substack over the next month so be sure you have made the transition to the DM Discord.
If you are an existing subscriber please see an email sent to you with subject “Transition to Discord” where we provide you step-by-step directions on how to move and maintain your existing membership.
For our free trial subscribers you have had a sneak peek into our daily trade plans and more importantly our intraday trading/chat room.

Don't miss out on these trade plans and intraday updates for as low as $29.99/month.

5 day free trial available!
SUBSCRIBE
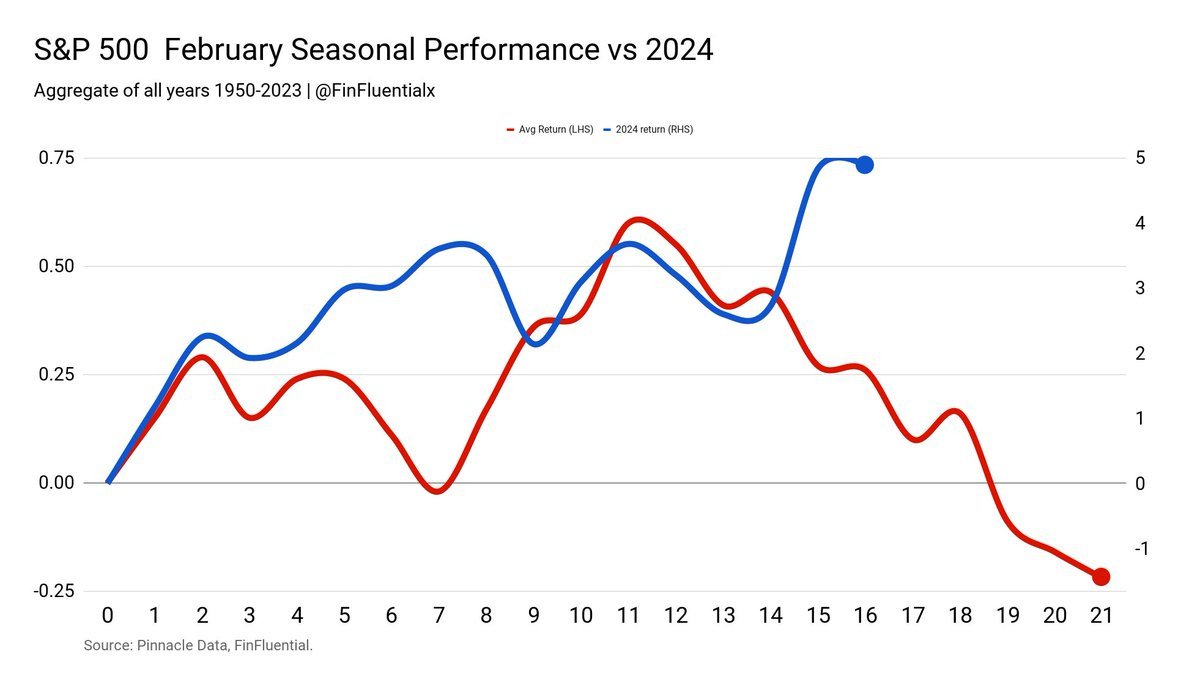
SPX’s Seasonal Performance for February typically shows weakness, but 2024’s market has continued to break this trend. At this point it is a buy the dip at key levels kind of market until proven differently…Be wary as always as we are entering what is typically a weaker period but the key words - prove it bears.


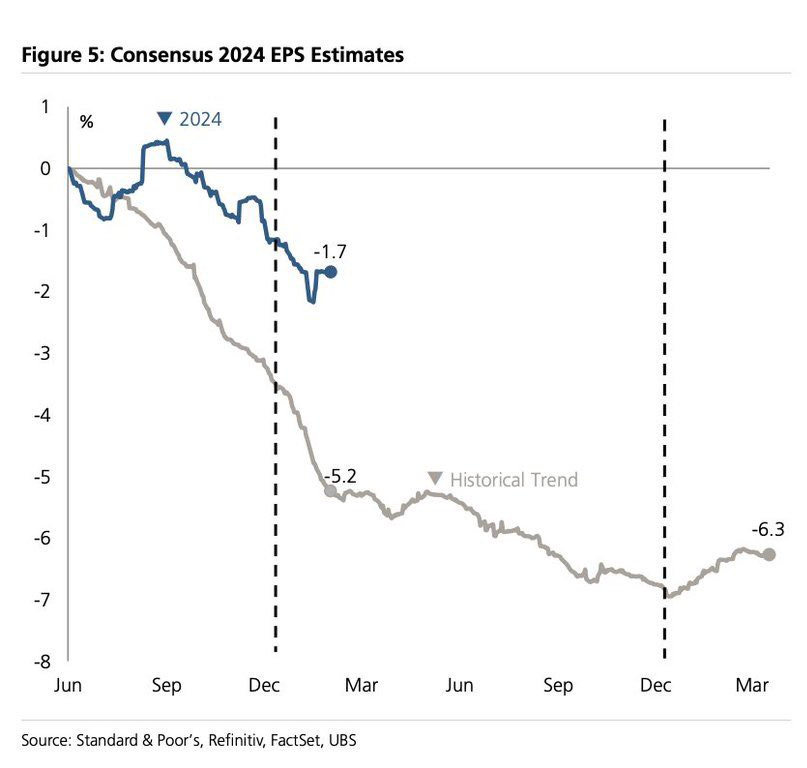
So why do we continue going up in a straight line? To put it simply it is EPS…This past quarter of earning reports was quite healthy and robust and looking at the below chart we are well ahead of market expectations. Consider this chart like a seasonality view of earnings per quarter. You can see how it declines historically as we go into the next 2 quarters of earnings, but this past quarter is well above historical trends.
So until you see something majorly break in this figure which are companies reporting negative earnings this will lend to a market that is…buy the dip.
Then you have this study from Wayne Whaley who shares that when December-February are each positive then the next year (March-February) is up 25 times and down 0 (zero) times. Yes you read that right…So for us in this newsletter and Discord this will be my outlook until proven otherwise. Just amazing stats here from Wayne, take a look.

2/26 News Catalysts
10:00am est - New Home Sales
For more information on news events, visit the Economic Calendar
Just a reminder for those not subscribed to our monthly or yearly paid subscription the newsletter will end here for you. You can still join us for the rest of the plan where we discuss key levels and entries to take and targets. Subscribe below. 


