

January 23, 2024 SPX, ES, SPY Trade Plan

Market Recap
After a massive 2 day rally the SPX took a break after getting above 4850 and getting as high as 4870. We are in uncharted territory as I mentioned and levels up are here all about discovery at this time. Longs will need a catalyst to continue to push them up, while bears have been burnt so much the past 2 months as well.
Overall pretty small range day in the SPX and as I mentioned after a monster 2 day rally markets don’t just go straight up or down. They need a bit of consolidation to coil and ready itself for the next move.
You can see this start to play out on the ES chart on the 4hr timeframe. Look at how the past 3 candles have all been inside candles. As that tightens we are going to get that next major move…
Our free preview to our chat room expired on Friday. For those in the chat room we triggered longs on Friday and use our chat room for intraday updates and targets as 0DTE options come on.While SPX didn’t net us a range to trade today, our trade plan on ADBE nicely played out. Some options going from 5 to over 10 playing that failed breakout of 620. On days like this I tried a long on SPX above 4860 and was quickly stopped out on it and instead I focused more on ADBE who had a clearer move through our key levels and trade plan.
Congrats to some of you who took this trade and had a nice healthy successful trading day although chop and sideways action on the SPX.

We saw a bit of a push up on the BPSPX chart. Key level is the 20MA and 50MA. As a bear we want to see a rejection of it going back towards the 20MA and breaking that 50MA.
 is a breadth indicator that measures the breadth of the S&P500. It shows the percentage of stocks in the S&P500 that are in an uptrend compared to a downtrend.")
As it does that on the daily chart let’s look into the weekly chart and you can see last week we still put in a bearish week. The MACD is now starting to curl down which is another good signal for our swing trade idea. We will continue to monitor this along with options data to ensure we are in a good place with our swing trades.
 is a breadth indicator that measures the breadth of the S&P500. It shows the percentage of stocks in the S&P500 that are in an uptrend compared to a downtrend.")
Here is a seasonality chart day-by-day of the trading sessions in January…

So far on the month the SPX is up 1.69%…
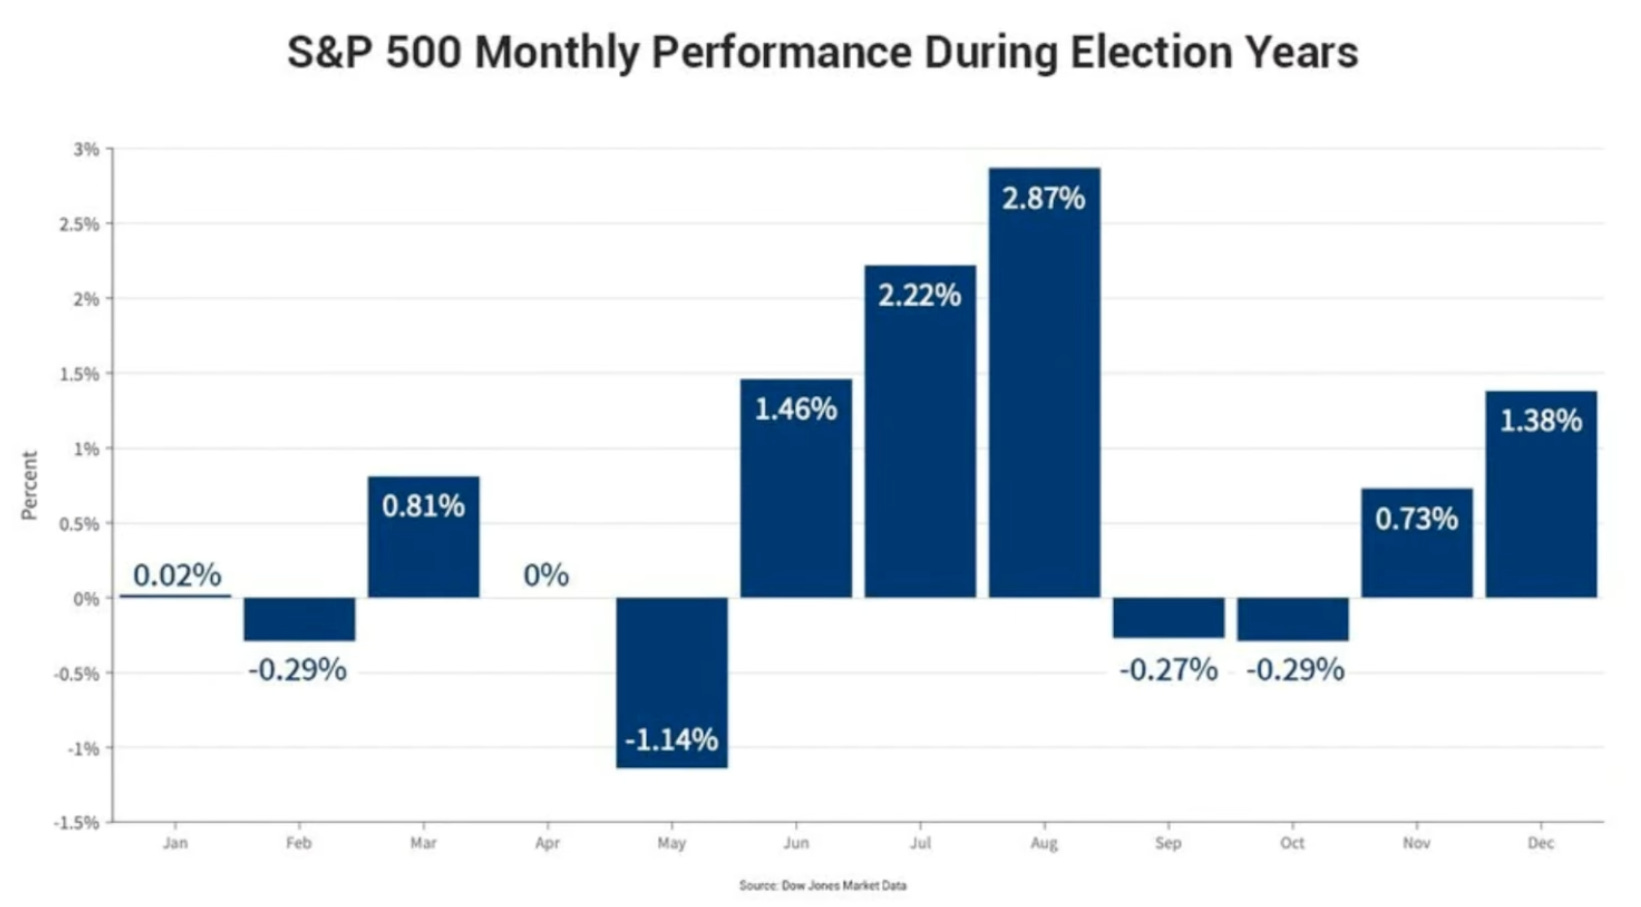
What we have to keep in mind with some of these seasonality charts is that we are in an election year. Seasonality instead looks like this which is another 2ish percent up from now until early/mid February before we then get a selloff going into March which negates the gains we make in January/February…
We will continue to monitor some of these seasonality views. There are a few of them out there and it will be important to see how the month ends to give us more insight into which seasonality chart it follows.

Just a reminder for those not subscribed to our monthly paid service the newsletter will end here for you. You can still join us for the rest of the plan by subscribing below. 