Dark Matter Trade

Dark Matter Trade

Share this post

Dark Matter Trade
Dark Matter Trade
January 26, 2024 SPX, ES, SPY Trade Plan
Copy link
Facebook
Email
Notes
More

January 26, 2024 SPX, ES, SPY Trade Plan

Dark Matter's avatar
Dark Matter
Jan 26, 2024
∙ Paid
1

Share this post

Dark Matter Trade
Dark Matter Trade
January 26, 2024 SPX, ES, SPY Trade Plan
Copy link
Facebook
Email
Notes
More
Share

Market Recap

Hello team. Futures action is moving quite fast today where we have price heading to testing our lows of yesterday’s session. Currently price is contained within 4845-4900. This zone will dictate which way/direction/leg we trade next.


The BPSPX broke below its 50MA. This is a great first sign. We know need to see how the market starts to react and if we start to see a bit of weakness in it over the next week.

The S&P500 Bullish Percent Index (BPSPX) is a breadth indicator that measures the breadth of the S&P500. It shows the percentage of stocks in the S&P500 that are in an uptrend compared to a downtrend.

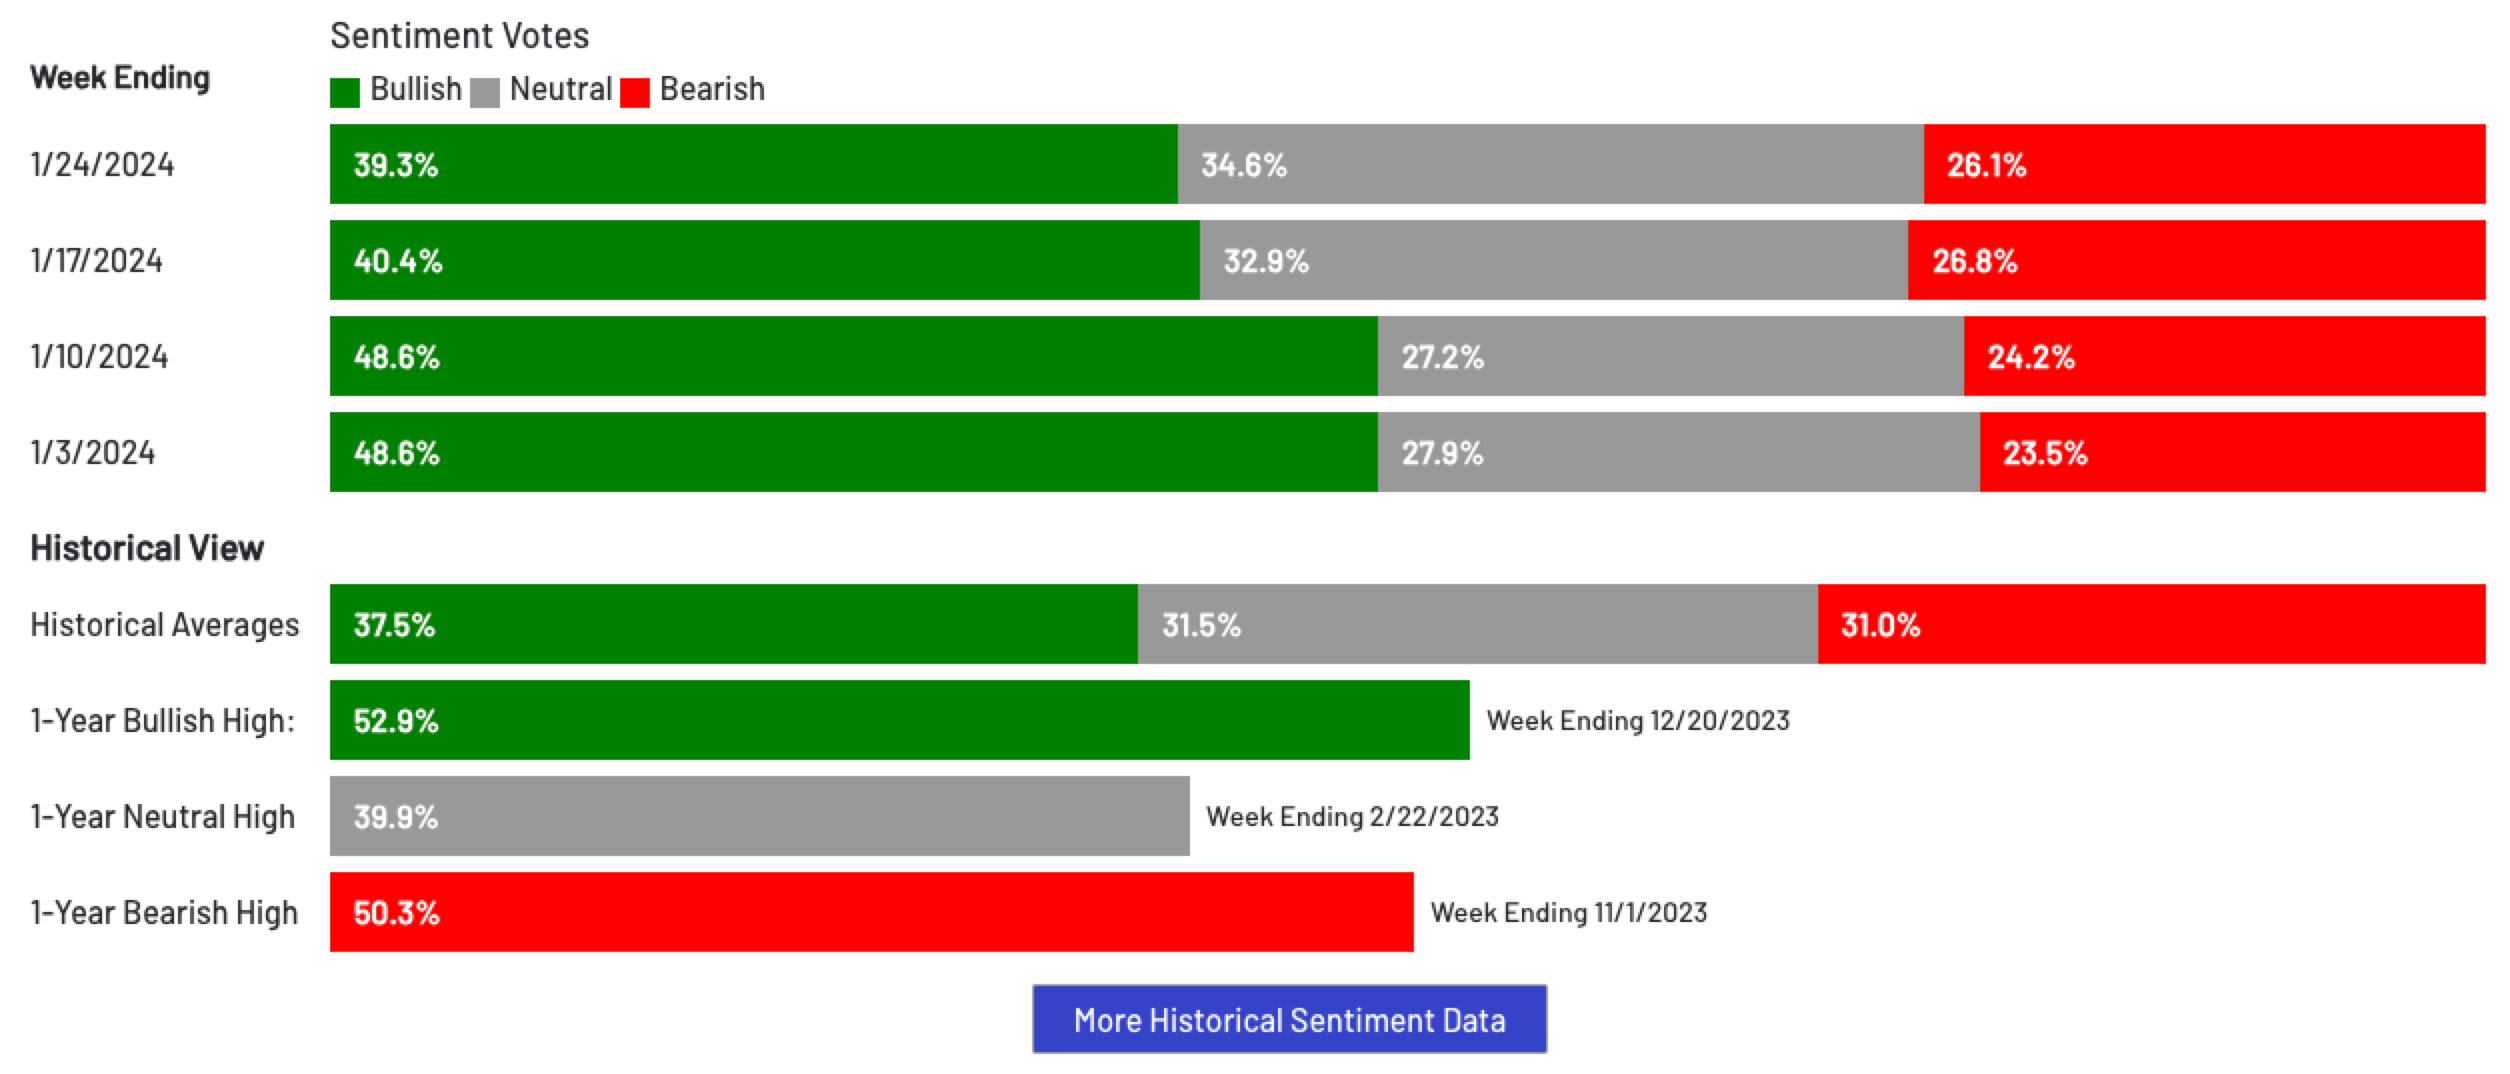
The new AAII Investor Sentiment Survey came out and we are seeing over the past month the bullish sentiment reduce with another reduction this week.

Here is a seasonality chart day-by-day of the trading sessions in January…

Image

So far on the month the SPX is up 2.61%…

SPX Monthly Performance During Election Years

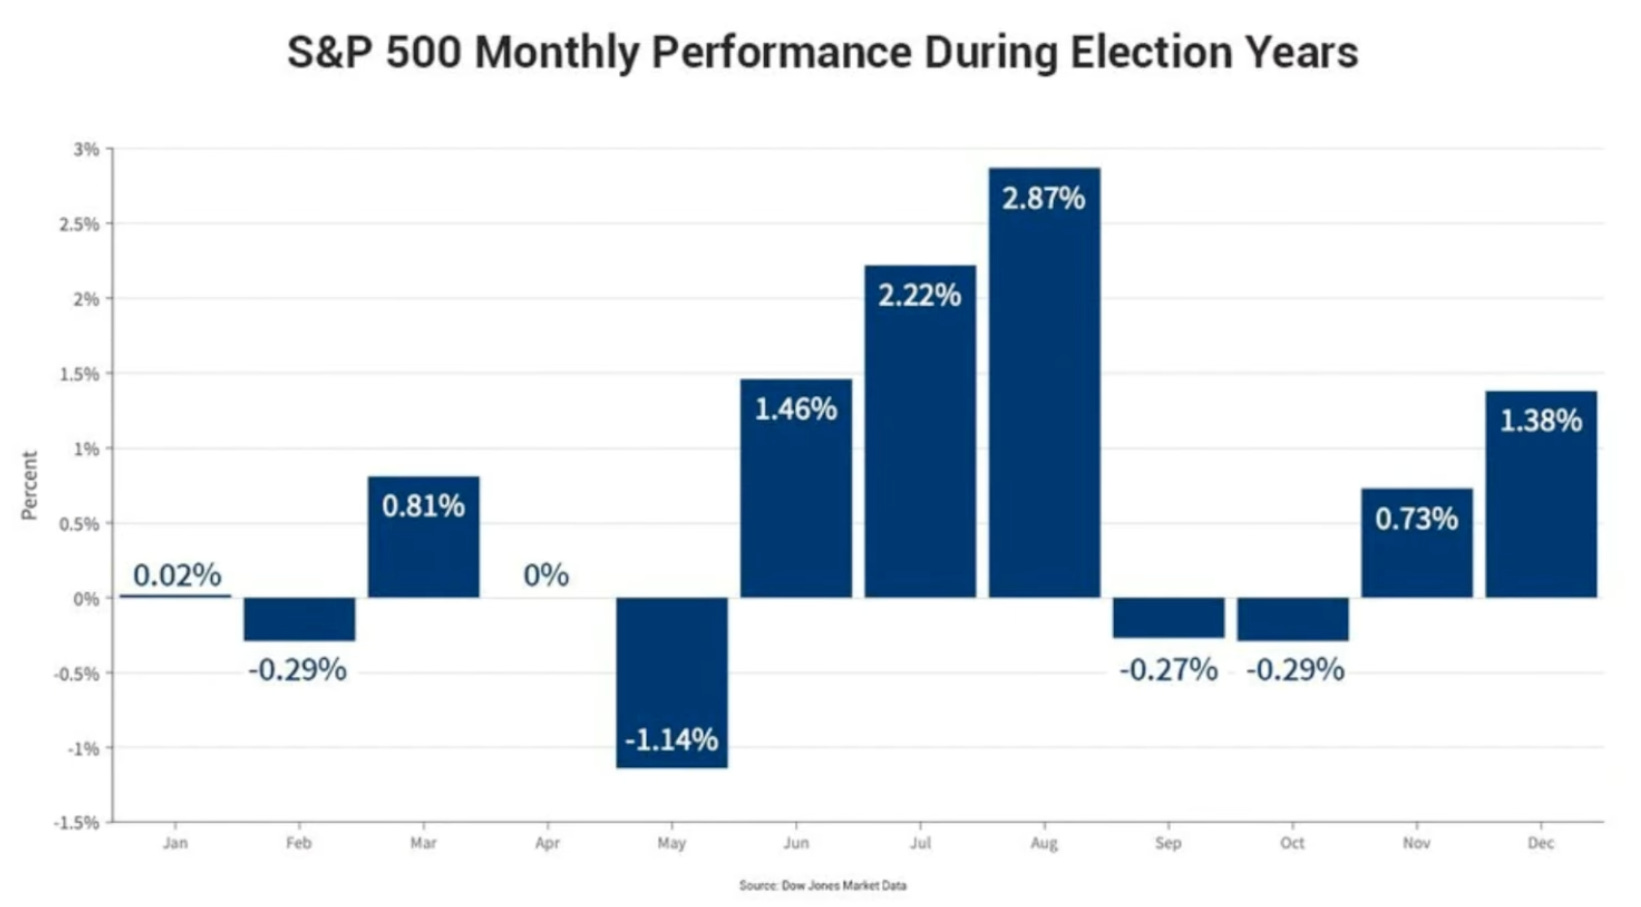
What we have to keep in mind with some of these seasonality charts is that we are in an election year. Seasonality instead looks like this which is another 2ish percent up from now until early/mid February before we then get a selloff going into March which negates the gains we make in January/February…

We will continue to monitor some of these seasonality views. There are a few of them out there and it will be important to see how the month ends to give us more insight into which seasonality chart it follows.

Election years are the second-best year of the four-year cycle, & the market has performed better with a sitting president running for reelection. There have been six election year declines greater than 5% since 1896 & the first five months of the year are stronger when the party in power retains the White House. But war can be a major factor.
Just a reminder for those not subscribed to our monthly paid service the newsletter will end here for you. You can still join us for the rest of the plan by subscribing below. 

Keep reading with a 7-day free trial

Subscribe to Dark Matter Trade to keep reading this post and get 7 days of free access to the full post archives.

Already a paid subscriber? Sign in
© 2025 Dark Matter Trade
Privacy ∙ Terms ∙ Collection notice
Start writingGet the app
Substack is the home for great culture

Share

Copy link
Facebook
Email
Notes
More