

January 29, 2024 SPX, ES, SPY Trade Plan

Market Overview
Hello team and welcome to another week of our trade plans. This week will be extremely volatile as we have a slew of events on deck. First and foremost are earnings. For the first time we have most of the Mag 7 reporting on the same week and all within 2 days this week. On Monday you have SMCI reporting. MSFT/AMD/GOOGL/UPS/GM/SBUX all report Tuesday. Wednesday has a couple of worthwhile tickers to see what they do - BA/QCOM/MC - and then the big one on Thursday with AAPL/AMZN/META.

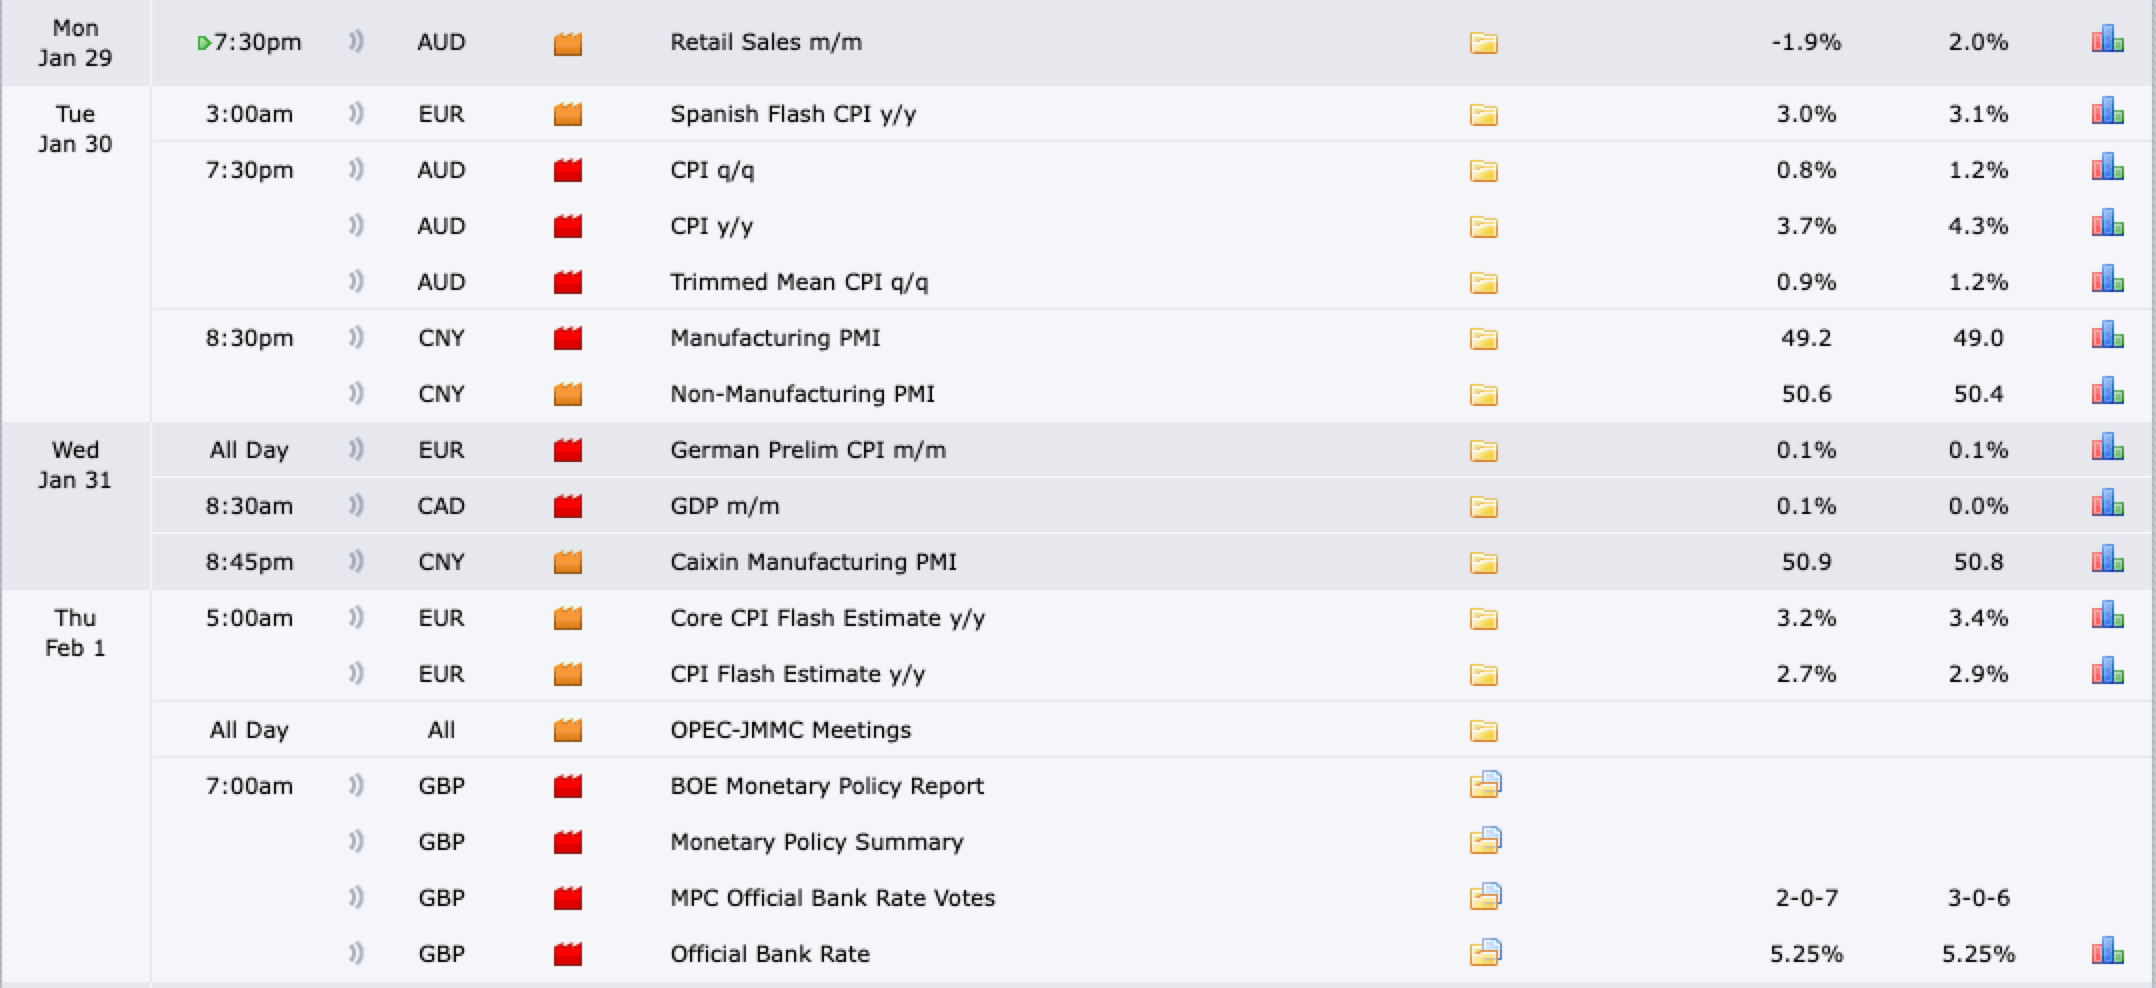
On top of ER’s look at all of the news that is occurring this week…massive jobs data and a visit from Daddy Powell and the FEDS on Wednesday with FOMC.

Let’s also not forget what is occurring with other markets across the globe. CPI from EU, PMI from China, and UK’s FOMC.
As you can see we are in store for what is one of the most volatile weeks in this years young trading calendar. Maintain good risk management, don’t full port in, and remember base hits. This is not a game of massive home runs, but base hits add up over time.
Let’s now review a few items across the market. First and foremost on the SPX as long as we are above 4800 the bulls are defending any up trend. For the bears you start making progress holding the market here at 4900.
I will discuss key levels on the week and month below in the trade plan.As we look at a few different charts such as SMH - the semi ETF - or AVGO you will see some of these tickers forming a chart pattern referred to as an Island Reversal. What is this?


An island reversal pattern indicates that the current trend is about to reverse. It's also called an island cluster or archipelago.
Here are some characteristics of an island reversal:
Two overlapping gaps
Compact trading activity within a range of prices
The gaps give it the appearance of a divided region
Traders with positions taken between the two gaps are stuck with losing positions.
Now let’s take a look at a two tickers showing this pattern…

When you compare SMH/AVGO to QQQ or even MSFT we are showing signs of a similar pattern forming depending on how this opens on Monday.
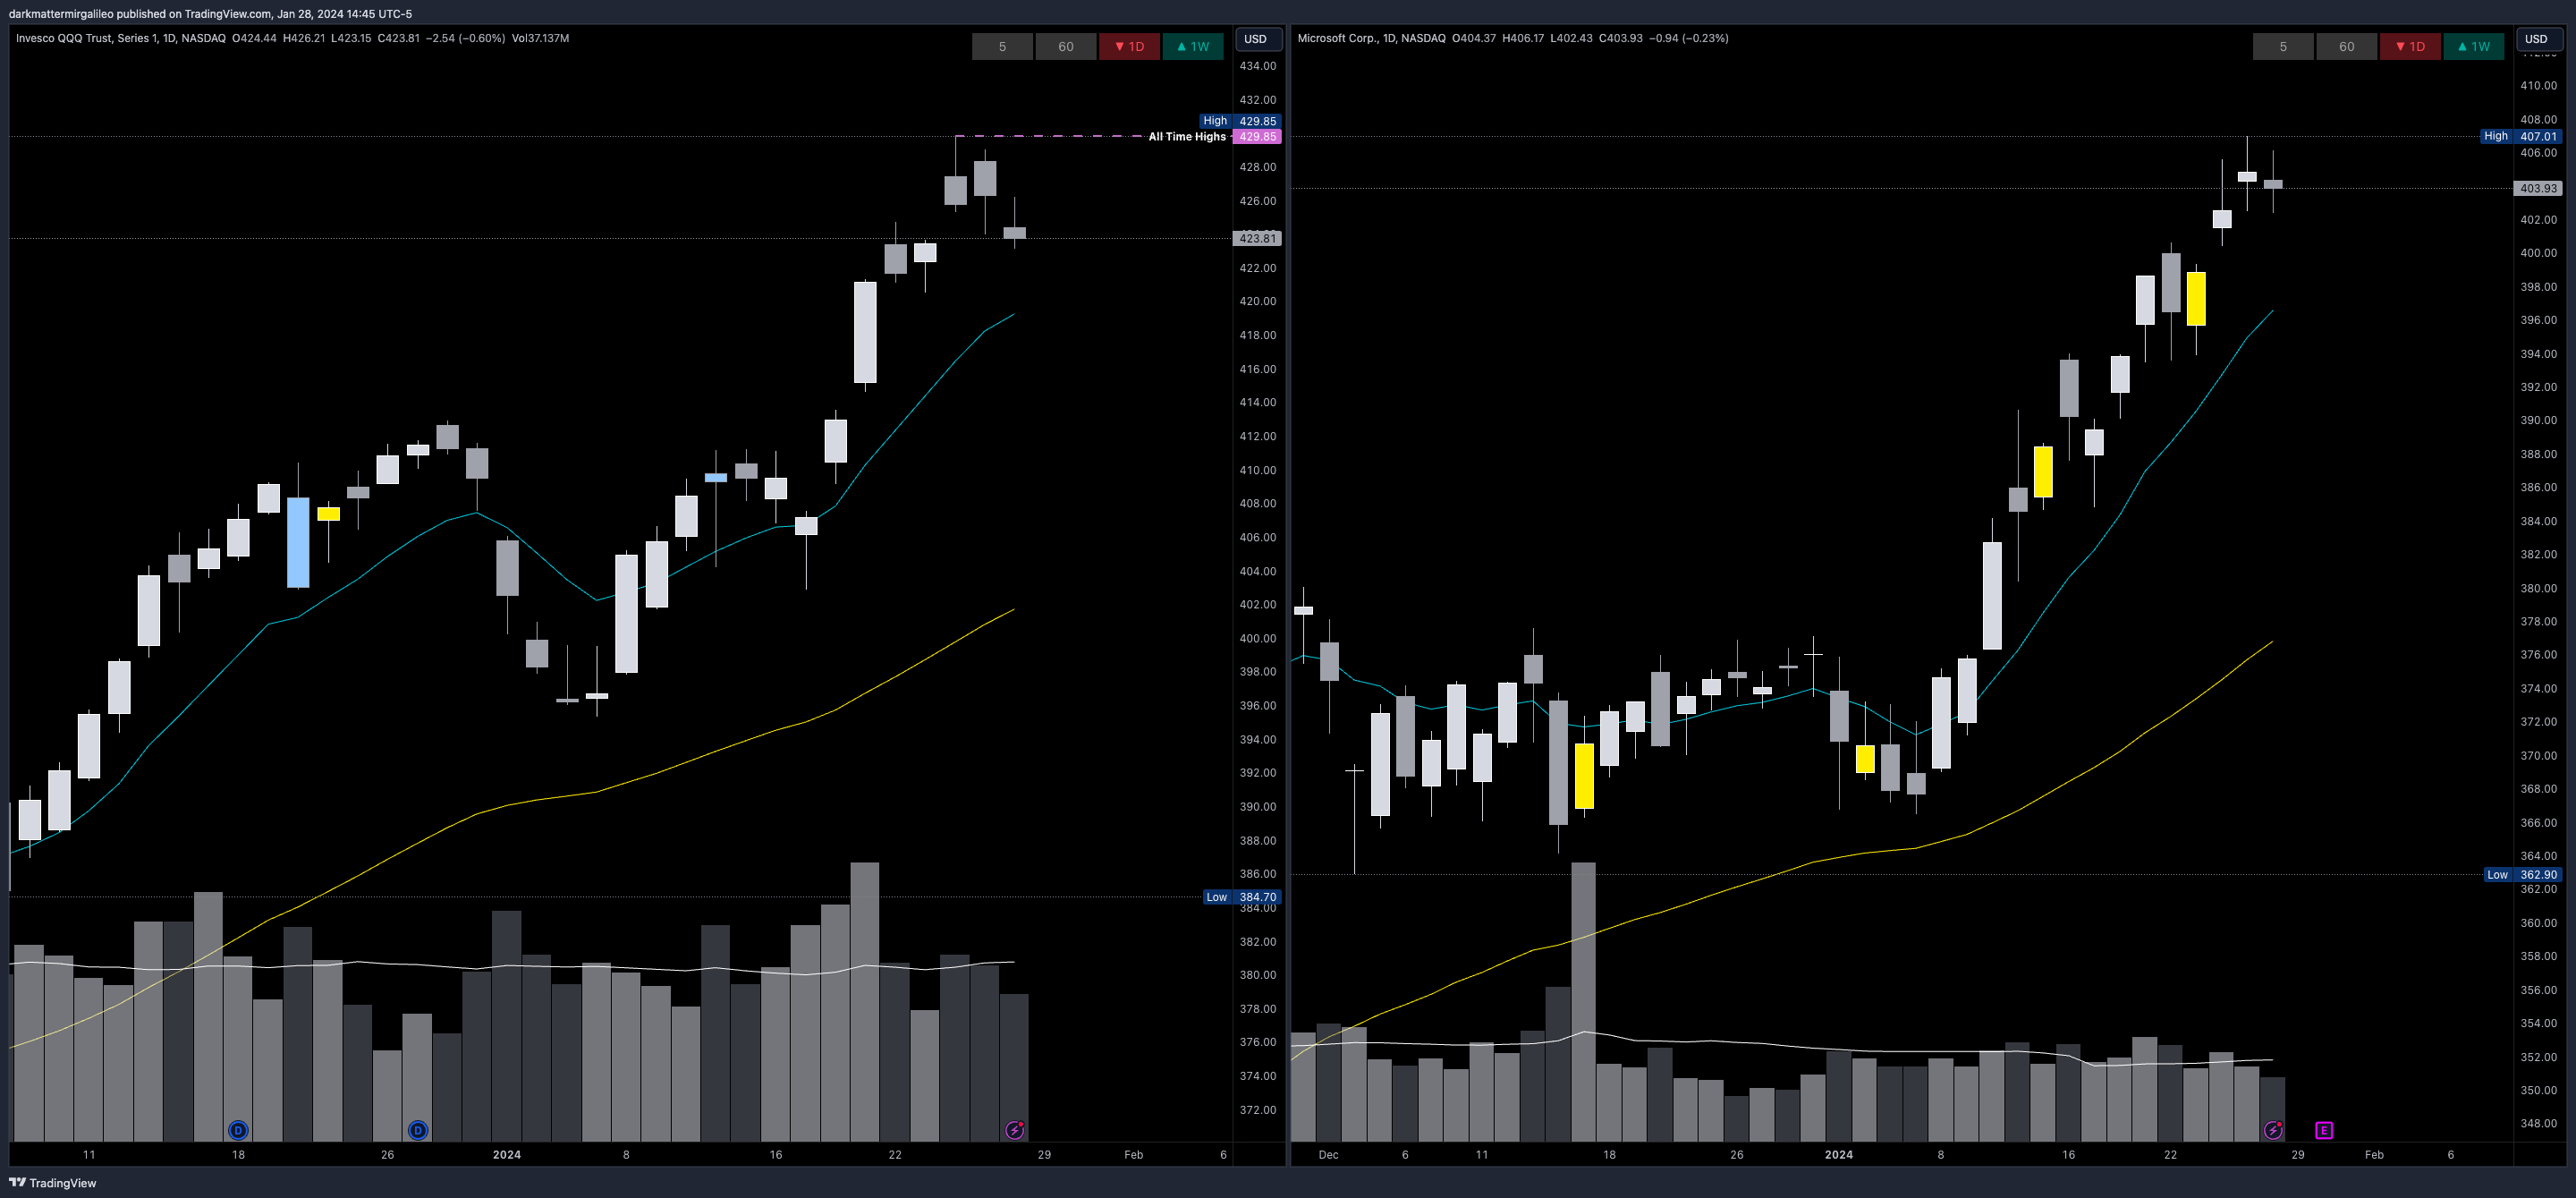
In summary this will not be the sole reason we stay in our swings or take a trade tomorrow, but these are signs in a weakening trend and more importantly exhaustion. That SMH one is an important one as it tracks all semi’s and while one ticker or the other may not be showing signs of a selloff - ie NVDA - it doesn’t mean it won’t.
This also doesn’t mean we are entering a bear market, but a healthy retracement is important for this market to continue its uptrend the rest of the year.
Let’s move on and review the BPSPX. Another weekly low and if we compare its trajectory to last year this time or even July this is the week it typically makes a big move on the weekly after consolidating.
 is a breadth indicator that measures the breadth of the S&P500. It shows the percentage of stocks in the S&P500 that are in an uptrend compared to a downtrend.")
So far on the month the SPX is up 2.54%…
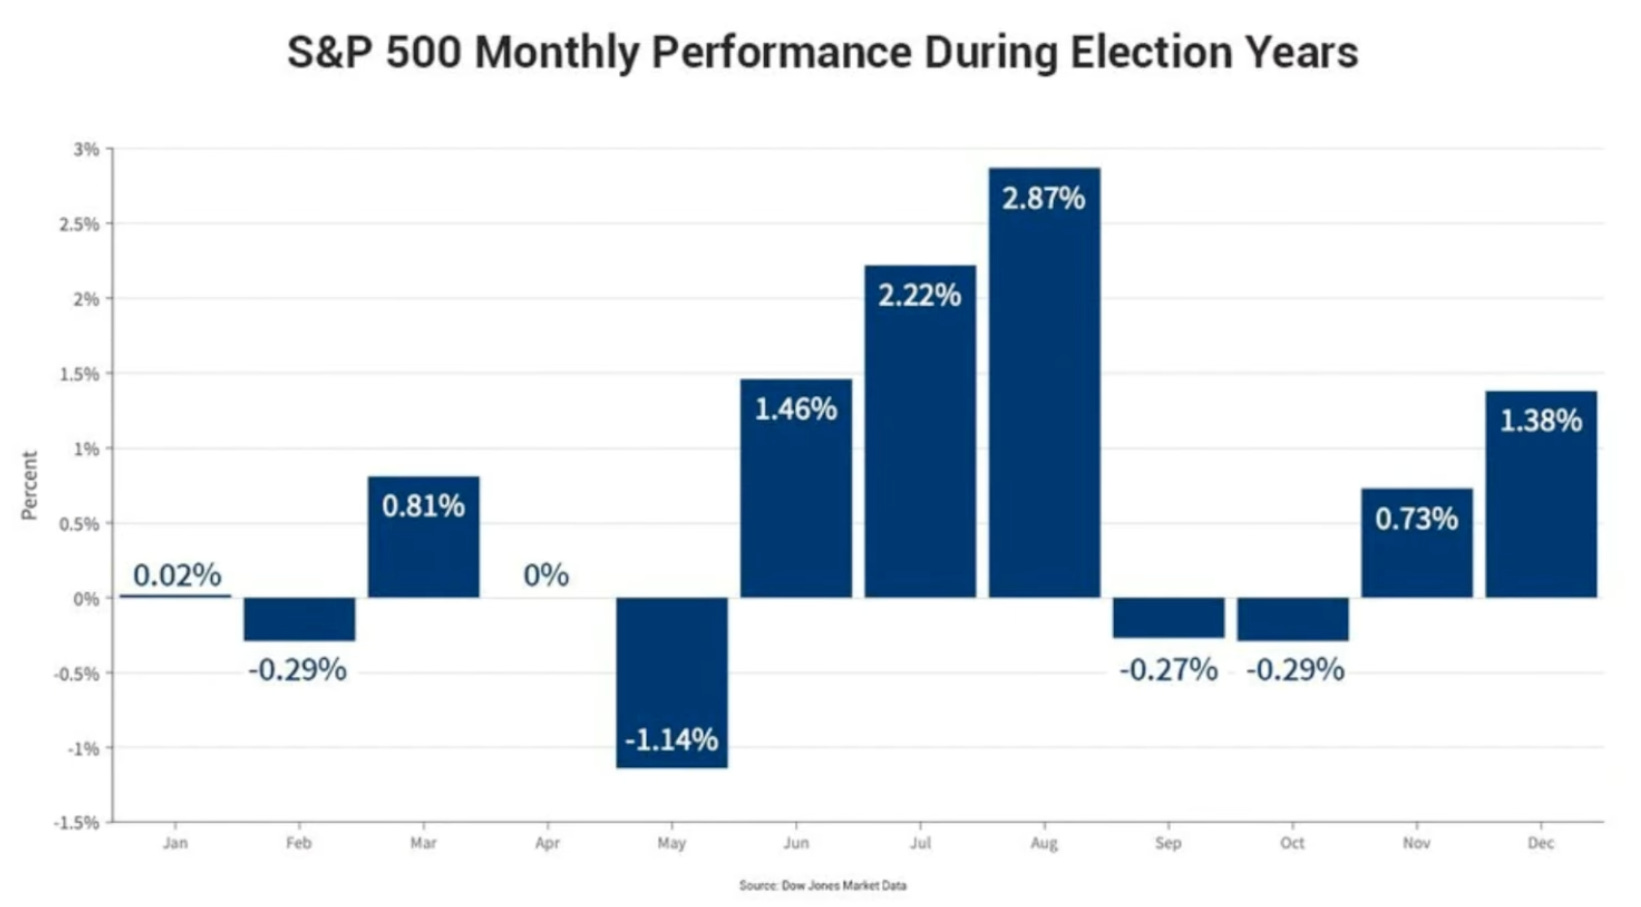
What we have to keep in mind with some of these seasonality charts is that we are in an election year. Seasonality instead looks like this which is another 2ish percent up from now until early/mid February before we then get a selloff going into March which negates the gains we make in January/February…
We will continue to monitor some of these seasonality views. There are a few of them out there and it will be important to see how the month ends to give us more insight into which seasonality chart it follows.

Just a reminder for those not subscribed to our monthly paid service the newsletter will end here for you. You can still join us for the rest of the plan by subscribing below. 