

January 31, 2024 SPX, ES, SPY Trade Plan

Market Recap
What a move by the bears today and did they do some damage. While we do have futures up the coming ER from AAPL/AMZN/META will be extremely critical if this market can push up anymore or have we seen an interim top in the market? Before we kick in to tomorrow’s trade plan let’s review today’s session.
As someone asked in the trade channel I typically try to wait the first 30mins, but there are exceptions. Was there premarket news? Yes there was. Are we trading at a key level and breaking down or breaking out of it? So in today’s case as we gapped down from yesterday’s close near 4922 to 4906 the minute we lost 4900 and never overtook it pushed me into our first trade of the day we shared in yesterday’s plan.
Below 4895-4890 target 4880
We basically traded within this range up until FOMC where I warned our group watch for the first and even the second move to be fakeouts. Boy did we gets this where we immediately sold off near 4870 and in real time I sent an update to our chat room that 4870 was the new LIS. If we go below that it will rip fast and quick to 4855.


And for those who went long we even shared an update to lock profits in as we got to 4900.

So all in all a great day for the community. Let’s do it again tomorrow, but based on how much of a move we made today and with tech earnings after hours if the morning news data including EU CPI and the UK’s FOMC statement doesn’t push us down further we could be trading a tight range awaiting ER’s and then Friday’s Non-Farm Employment numbers and Avg Hourly Earnings.
In summary don’t give back your profits from today. Trade smart. Be paytient and react to key levels like we did today.
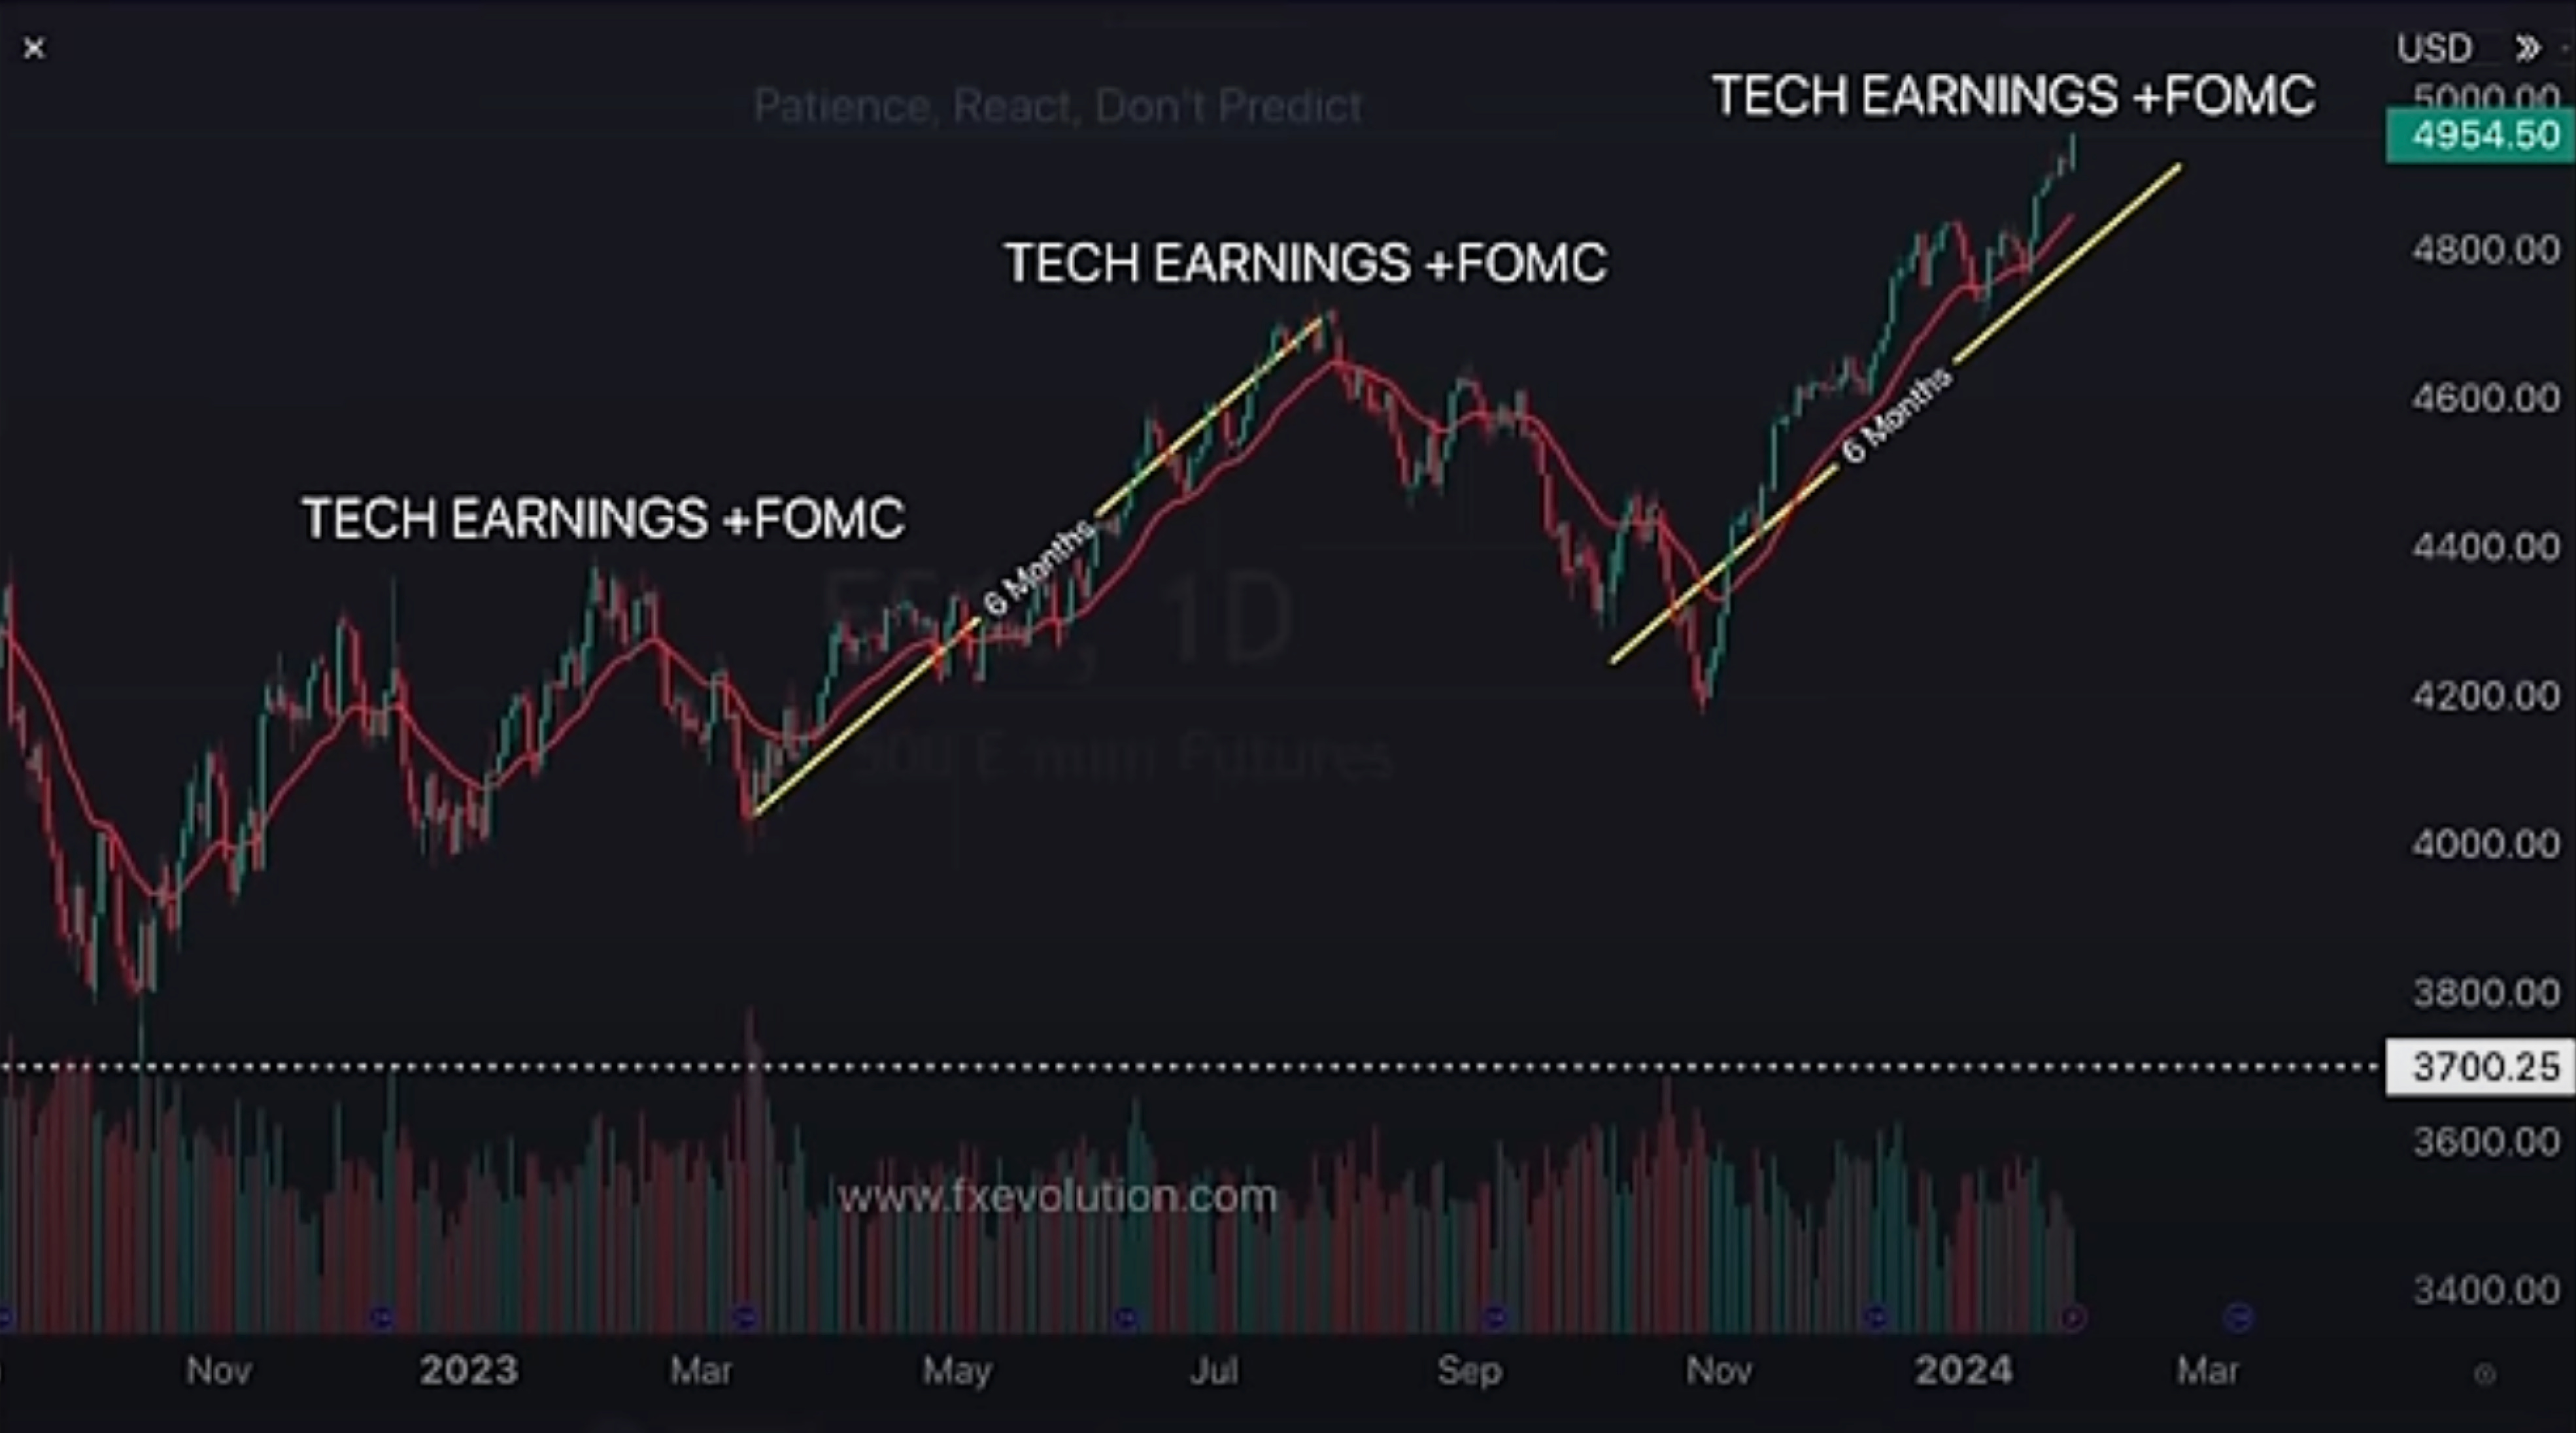
Interesting stat/chart of the day…Notice how when we have had Tech Earnings+FOMC in the past notice how we sold off last time? We had a 6 month run and then boom sell…Will this replicate? No predictions, but data is backing our thesis.
Additionally, here is a stat where after the QQQ declines 1.5% on FOMC day there is more downside pressure going into the next month. While yes positive 53% of the time that narrative would not hold as a trade idea IMO.

There we have the touching of the 20MA and 50MA on BPSPX. We want this to hold and have the 20MA continue to cross down and what I think shifts to a sell the rip campaign instead of a buy the dip campaign. The RSI turned back down, the MACD is pointing down too and that cross to turn it bullish has also been rejected…
 is a breadth indicator that measures the breadth of the S&P500. It shows the percentage of stocks in the S&P500 that are in an uptrend compared to a downtrend.")
From a seasonality chart we can say for certain that the below trajectory is the data point we want to focus on. We will continue to track this view throughout the year…

Additionally, here is a seasonality chart of February. As I mentioned in our chat room, the first trading day of February is typically bullish 60% of the time. Additionally, there is a bit of a rally and then selloff again the first 6 trading days, followed by another rally mid February/post OPEX where we get a bigger selloff.
See how the two charts combined tell a similar story?

Just a reminder for those not subscribed to our monthly paid service the newsletter will end here for you. You can still join us for the rest of the plan by subscribing below. 