July 10, 2023 SPX, SPY, ES Trade Plan
Good evening/day/morning traders. Friday started out well for the bulls where we opened below our bearish bias level of 4405. As always I don’t go chasing so I waited to see what the first half hour of the trading session was going to do. We quickly got bought up targeting 4415, which was our bullish bias level. SPX quickly then sold off from here hitting a low of 4402 before quickly overtaking the 4405 level where I took some longs targeting our first target at 4430.
I closed most of my positions here as I felt iffy about the data getting us to 4445. While we did get to 4440 and a nice 10pt trade the end of day saw an immediate selloff wiping the entire gains of the day and ultimately closing at 4398 right where we opened the session.
Are the bulls still in control? Are the bears fighting back now? My personal opinion is we are just in a wide chop range where price is consolidating waiting for its next move. That range in my opinion is 4380-4460. Until we see one side breakout of these levels we will continue to chop up and down.
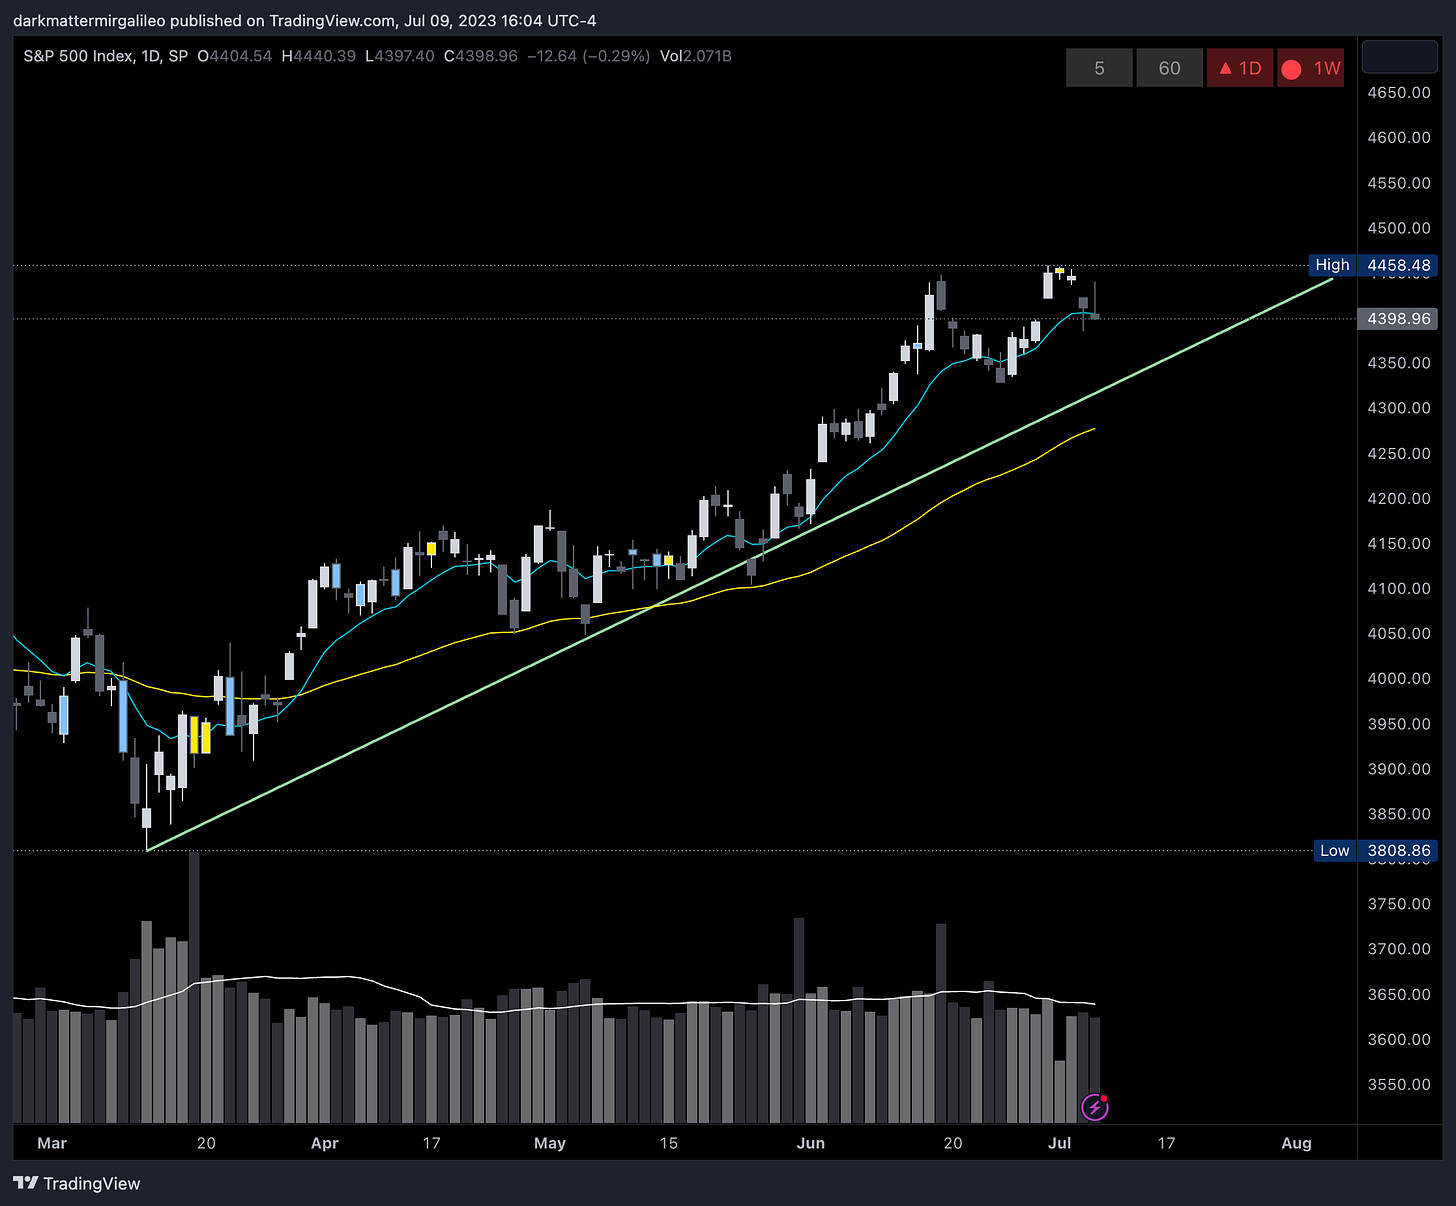
For those in chart patterns, take the lows from May and June connecting them and this gives you the uptrend we are currently in and the potential gap down left which will be attractive to bears looking to push price down. It looks like this:
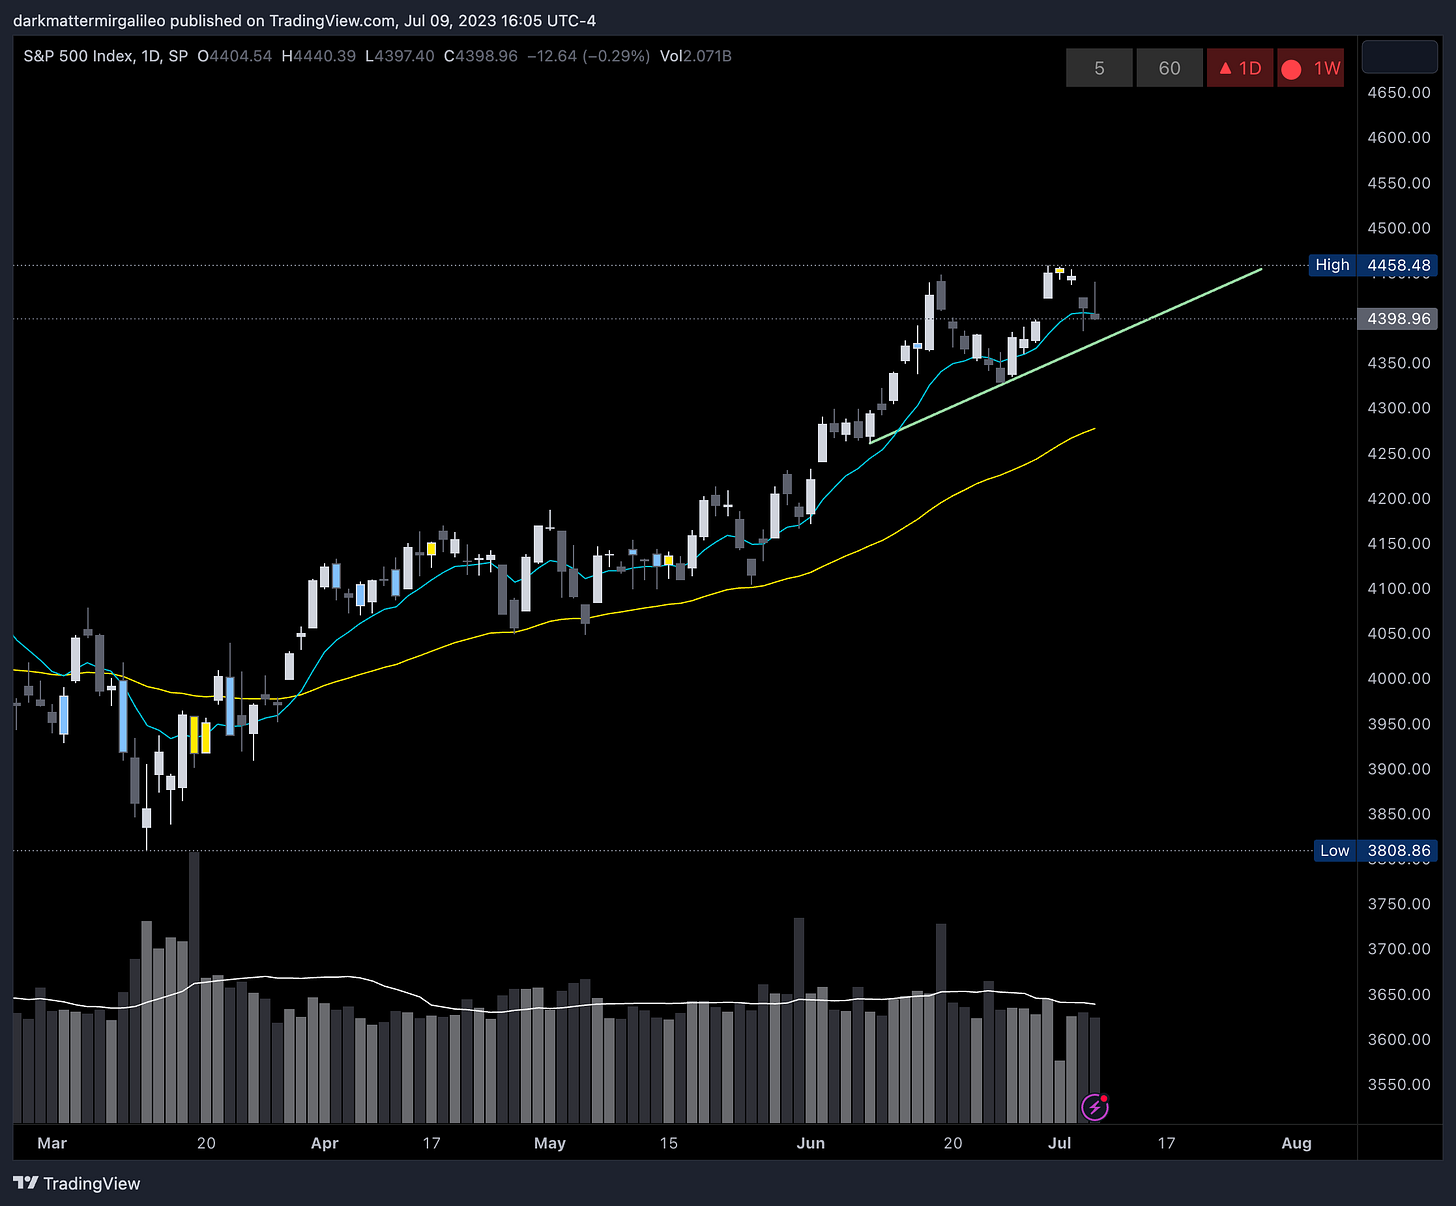
Now look for the basing after June’s lows. We have another trendline. Here is what it looks like:
Now draw a resistance trendline where price has sold off from the highs. It looks like this:
Alright now enable those uptrend lines and you can see we have an ascending triangle and if you run a trendline from the December to February highs you will see a parallel channel. Short term we are almost at the bottom of the first triangle and this is near 4385 before it touches the bottom and either bounces from it or invalidates this triangle. Our second triangle resides at a low of 4325.
Thus 4385 and 4325 become two critical points of interest for the bulls if they want to continue these trends. Otherwise we wait to see and find a new trend.
In terms of key events this week we are relatively quiet on the numbers front until Wednesday where we get premarket data on the latest CPI print and later that day we have the 10-y Bond Auction. Thursday provides us with the latest PPI print and latest unemployment claims. We close out Friday with the Prelim UoM Consumer Sentiment and Inflation Expectations.
So in summary I will stick to my trade plan, react to key levels and why they are important, and trade until I hit the target or my stop loss. I don’t want to get in the game of predicting cause I don’t know if the next 200-400 pt move is going to be up or down…
Overview (TL;DR)
As mentioned above bulls need to keep price above 4380 if they want to continue this trend otherwise we will selloff then to 4325. If this level holds I do expect us to chop and target Friday’s highs.
For the bears it is simple - start to take out key levels. It starts by continuing to push below 4395 targeting 4380. The fun starts with the break of 4380-4375 which will then selloff towards 4325 (not 0DTE).
As I mentioned Friday, if 4380-4375 holds I think this starts the next leg in this rally targeting a new high of the year near 4475 and above it towards 4500. It won’t come fast or straight up, but if the bears can’t push this below 4325 I can’t turn bearish.
ER’s are coming up in a couple of weeks so along with bullish seasonality in July we could see a run up prior to ER’s. As most expect this earnings season to be bad will we finally start to sell then? Again no predictions, we play level-to-level, and take our profits when our targets our hit or we exit if we get stop loss’d. Stick to the levels and keep an eye on Volland30 and the VOLD indicator.
Let’s jump into the trade plan.
For intraday updates please follow me on Twitter @DarkMatterTrade.
News Catalyst
10:00am est - FOMC Member Barr Speaks
10:00am est - Final Wholesale Inventories m/m
11:00am est - BOE Gov Bailey Speaks
For more information on news events, visit the Economic Calendar
SPX/ES/SPY Trade Plan
Bullish bias:
Above 4400 target 4415
If there is a failed breakdown of 4380 or 4375 target 4400
If there is a breakout of 4420 target 4435
Bearish bias:
Below 4395 target 4380
If there is a failed breakout of 4415 or 4420 target 4400
If there is a breakdown of 4375 target 4360
If there is a breakdown of 4360 target 4345
As always keep an eye on Volland30, VOLD indicator, and the VIX for trend continuation or reversals.
Remember you can use this SPX trade plan to trade ES or SPY. ES value is approx. 36pts more than the SPX levels shared. To get SPY levels simply take the SPX levels and divide by 10.03.
SPX - The Why Behind the Plan
Key Levels
Above Spot:
4400-4420 - negative vanna
4425 - positive gamma
4410-4405 - 439.74-439.22 - $8.53B
4430-4445 - negative vanna
4450 - positive gamma
4442-4452 - OB (1hr chart)
4447 midline
4445 - 444.02-443.18 - $8.93B
Below Spot:
4380 - negative vanna
4380 - positive gamma
4393-4380 - OB (1hr chart)
4386 midline
4397-4393 - 438.48-438.06 - $7.74B
4384-4378 - 437.18-436.54 - $19.47B
4375-4362 - OB (1hr chart)
4369 midline
4325 - negative vanna
4325 - positive gamma
4344-4328 - OB (1hr & 2hr chart)
4336 midline
Dark Pool Levels
The 4393-4393 level saw an increase of approx $4B while the 4410 level saw an additional $2B of dark pool print.
4445 - 444.02-443.18 - $8.93B
4410-4405 - 439.74-439.22 - $8.53B
4397-4393 - 438.48-438.06 - $7.74B
4384-4378 - 437.18-436.54 - $19.47B
4349-4344 - 433.65-433.19 - $9.39B
4325 - 431.26 - $4.19B
4309 - 429.64 - $6.81B
4293 - 428.09 - $7.46B
4214-4212 - 420.16-420.03 - $8.05B
4204-4188 - 419.20-417.60 - $16B
We need to pay attention to these dark pool levels. Remember the levels where we see dark pool prints greater than $4B should peak our interest. I get my dark pool levels from Quant Data.
Orderblocks (OB) and Fair Value Gaps (FVG)
These are smart money concepts and some areas I am looking to see how price reacts. I will give higher credence to OB’s whereas FVG’s could be areas of basing/consolidation if they break.
Resistance levels - at these levels I want to see if price rejects to short or consolidates for a push up. I couple this data with Volland, intraday option flows, and Dark Pool levels. Higher timeframe OB’s or FVG will be harder to break. OB’s are the stronger levels over FVG’s.
4442-4452 - OB (1hr chart)
4447 midline
4461-4482 - OB (2hr chart)
4472 midline
4475-4520 - OB (4hr chart)
4497 midline
Support levels - at these levels I want to see if price rejects to long or consolidates for a push down. I couple this data with Volland, intraday option flows, and Dark Pool levels. Higher timeframe OB’s or FVG will be harder to break. OB’s are the stronger levels over FVG’s.
4393-4380 - OB (1hr chart)
4386 midline
4375-4362 - OB (1hr chart)
4369 midline
4344-4328 - OB (1hr & 2hr chart)
4336 midline
4304-4297 - OB (1hr chart)
4301 midline

Weekly Option Expected Move
SPX’s weekly option expected move is ~58.69 points. SPY’s expected move is ~5.93. That puts us at 4504 to the upside and 4396 to the downside. For SPY these levels are 448.67 and 437.89.
Remember over 68% of the time price will resolve it self in this range by weeks end.
Volland Data
For a better understanding of the various greeks below I would suggest you visit the Volland YouTube Page. Volland provides unique data showing where dealers are positioned providing in my opinion a higher degree of conviction to where price may move to.
Vanna - Levels where price may repel or act as magnet
Remember for price to go above spot through a magnet or repellent VIX and IV must decrease or stay flat. For price to go below spot through a magnet or repellent VIX and IV must increase.
Positive vanna - will act as magnet
Negative vanna - will act as repellent
When price goes through a positive or negative level it will flip it - ie negative becomes positive and vice versa.
Above Spot:
4400-4420 - negative vanna
4430-4445 - negative vanna
Below Spot:
4380 - negative vanna
4325 - negative vanna
Gamma and Delta-Adjusted Gamma (DAG)
Positive Gamma Above Spot - acts as resistance - meaning that dealers want to push against the move
Positive Gamma Below Spot - acts as support - meaning that dealers will want to support price at these levels
Negative Gamma - becomes permissive to price as it moves there - aka neither resistance nor support - simply just chillin and watching what’s happening…
Above Spot:
4425 - positive gamma
4450 - positive gamma
4470 - positive gamma
Below Spot:
4380 - positive gamma
4325 - positive gamma
Charm
Remember if IV is not expanding charm will start to overtake Vanna especially 0DTE as it comes closer to expiration.
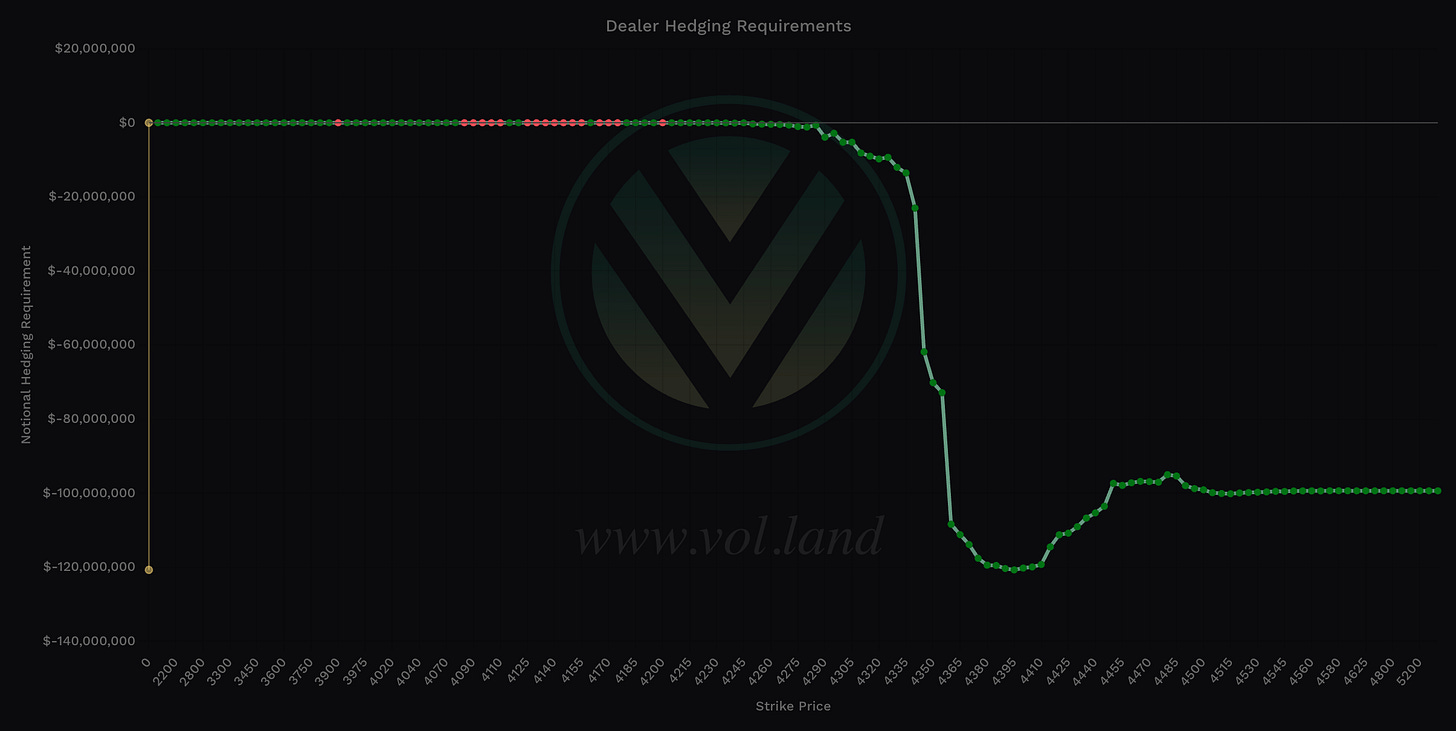
Charm total notional value is bullish - negative is bullish and positive bearish - take the total of the far left and far right values.
The 0DTE view on SPX Charm shows a bullish bias. I would expect any dips to be bought intraday.
Note that the total notional value of SPX is 10x. Thus it’s charm will outweigh that of SPY’s. For the full charm effect to play out ideally we want to see SPX and SPY in sync.
So what does SPY’s charm tell us? It is leaning bearish at an aggregate view.
If we look at SPY for 0DTE we are seeing a bearish charm view.
To cover our basis…
Welcome to my Substack where I provide a daily SPX trading plan to help guide my intraday trading. The purpose of this letter is not to advice you on your trading or investment decisions. I am simply documenting my daily trading plan for myself to help with planning and execution. These are simply my opinions and the data sourced from the likes of vol.land, TradingView, Quant Data and others. The stock market is risky, gains are not guaranteed. This is not about getting rich quick, but learn to educate yourself and make the necessary financial decisions on your own. This is not financial advice.


