July 25, 2023 SPX, SPY, ES Trade Plan
7/24 Trading Session Review
Our key pivot level of 4535 held as the SPX hit a low of 4541 before it rallied targeting 4563 hitting our bullish trade idea:
If there is a failed breakdown of 4535 target 4550
Above 4550 target 4560
Additionally, we also said…the 30 min candle closed right at this level.
If we gap up or price hits 4545 in the first half hour and we can’t hold it, I would go short target 4520.
All in all a successful trade plan given how low the volume was - ES trade only 1.15M lots, typically for a normal ATR move on ES we would expect closer to 2M lots. Ahh the fun that is summer low volume trading.
Tomorrow brings us a key news event premarket and then major tech ER’s with MSFT and GOOGL reporting. Buckle up, don’t trade like a casino if you plan to take an ER play and off we go.
SPX/SPY/ES Overview (TL;DR)
The key level is 4550 - if we hold we will test 4560 again potentially 4565. There is a major bearish oderblock sitting in that zone that I find will be tough for the bulls to break through unless we get amazing earnings from MSFT and GOOGL.
If 4550 doesn’t hold we target 4535 and a break of it could trigger further selling to 4520.
Let’s jump into the trade plan.
ADBE
It held that key level we discussed in yesterday’s trade plan where 517.5 traded, closed the gap, briefly sold down to a low of 514.86 only to be bought up and rally to a high of 524.
Ultimately, I think price is targeting 530 with a potential overshoot to 535 where it faces a bearish orderblock. Major supply zone and if you are a bear you don’t want Adobe trading above 535.
Above 525 target 530
If there is a failed breakdown of 515 target 520
If there is a failed breakout of 530-535 target 515
Below 515 target 510
V
Another great ticker we had on our list and it opened at 239, sold off to 238 where it found a bullish orderblock and from there it was goodbye as it hit a high of 241.
I don’t think it is over for Visa. As long as 240 holds we should see 247.5 where we find a speed bump and I think where we will dip and then all eyes will be on ER and if we target towards 260 or reverse course and sell off.
Above 240 target 247.5 - speed bump at 242.5
Below 240 target 235
MSFT
Not shockingly MSFT went into distrubtion / accumulation mode where we chopped within a range of 342-346 showing no strength to either side. The play on this is obviously ER for tomorrow and while our trade levels from yesterday hold true going into ER this completely comes down to the ER report - thus play with caution and manage risk. I have no lean on this and simply sharing some informational levels. If I see anything majorly change prior to close of session I will share on Twitter.
Above 345 target 357.5
Below 340 target 330
For intraday updates please follow me on Twitter @DarkMatterTrade.
News Catalyst
9:00am est - HPI - change in purchase price of homes with mortgages backed by Fannie Mae and Freddie Mac
9:00am est - Change in single-family home sales - S&P/CS Composite-20 HPI y/y
10:00am est - CB Consumer Confidence
10:00am est - Richmond Manufacturing Index

For more information on news events, visit the Economic Calendar
SPX/ES/SPY Trade Plan
Bullish bias:
Above 4580 target 4595
If there is a failed breakdown of 4550 target 4560-65
Bearish bias:
Below 4550 target 4535
If there is a failed breakout of 4560 target 4550
If there is a breakdown of 4535 target 4520
As always keep an eye on Volland30, VOLD indicator, and the VIX for trend continuation or reversals.
Remember you can use this SPX trade plan to trade ES or SPY. ES value is approx. 28pts more than the SPX levels shared. To get SPY levels simply take the SPX levels and divide by 10.03.
SPX - The Why Behind the Plan
Key Levels
Above Spot:
4560-4565 - negative vanna
4555-4575 - positive gamma
4560-4574 - OB (1hr chart)
4567 midline
4565-4554 - 455.22-454.10 - $9.17B
4580 - negative vanna
4585 - positive gamma
4574-4583 - OB (2hr chart)
4578 midline
4600 - negative vanna
4589-4597 - OB (30min chart)
4593 midline
Below Spot:
4550 - negative vanna
4550 - positive gamma
4540-4535 - OB (30min chart)
4538 midline
4536-4534 - 452.29-452.14 - $7.5B
4529-4520 - OB (30min chart)
4525 midline
4505 - negative vanna
4500 - positive gamma
4511-4500 - OB (1hr chart)
4506 midline
4522-4509 - 450.89-449.62 - $14.81B
4490 - negative vanna
4475 - positive gamma
4481-4466 - OB (1hr & 2hr chart)
4473 midline
4471 - 445.84 - $3.17B
4453-4438 - 444.02-442.48 - $20.06B
Dark Pool Levels
Another +$2B of dark pool came in at the 4536 level where we can clearly see this has become a new level of interest. Will it continue to push us down? In due time we will know, but we mark it as a key level for now…
4565-4554 - 455.22-454.10 - $9.17B
4536-4534 - 452.29-452.14 - $7.5B
4522-4509 - 450.89-449.62 - $14.81B
4471 - 445.84 - $3.17B
4453-4438 - 444.02-442.48 - $20.06B
4421-4393 - 440.85-438.06 - $25.11B
4384-4375 - 437.18-436.20 - $24.71B
4349-4344 - 433.65-433.19 - $12.14B
4325-4292 - 431.26-427.92 - $18.46B
We need to pay attention to these dark pool levels. Remember the levels where we see dark pool prints greater than $4B should peak our interest. I get my dark pool levels from Quant Data.
Orderblocks (OB) and Fair Value Gaps (FVG)
These are smart money concepts and some areas I am looking to see how price reacts. I will give higher credence to OB’s whereas FVG’s could be areas of basing/consolidation if they break.
Resistance levels - at these levels I want to see if price rejects to short or consolidates for a push up. I couple this data with Volland, intraday option flows, and Dark Pool levels. Higher timeframe OB’s or FVG will be harder to break. OB’s are the stronger levels over FVG’s.
4560-4574 - OB (1hr chart)
4567 midline
4574-4583 - OB (2hr chart)
4578 midline
4589-4597 - OB (30min chart)
4593 midline
4652-4665 - OB (1hr, 2hr chart)
4658 midline
Support levels - at these levels I want to see if price rejects to long or consolidates for a push down. I couple this data with Volland, intraday option flows, and Dark Pool levels. Higher timeframe OB’s or FVG will be harder to break. OB’s are the stronger levels over FVG’s.
4540-4535 - OB (30min chart)
4538 midline
4529-4520 - OB (30min chart)
4525 midline
4511-4500 - OB (1hr chart)
4506 midline
4498-4493 - OB (15min chart)
4495 midline
4481-4466 - OB (1hr & 2hr chart)
4473 midline
4408-4399 - OB (2hr chart)
4404 midline
4393-4380 - OB (1hr chart)
4386 midline
4375-4362 - OB (1hr chart)
4369 midline
4344-4328 - OB (1hr & 2hr chart)
4336 midline
4304-4297 - OB (1hr chart)
4301 midline

Weekly Option Expected Move
SPX’s weekly option expected move is ~60.84 points. SPY’s expected move is ~6.22. That puts us at 4560.44 to the upside and 4450.38 to the downside. For SPY these levels are 458.40 and 445.96.
Remember over 68% of the time price will resolve it self in this range by weeks end.
Volland Data
For a better understanding of the various greeks below I would suggest you visit the Volland YouTube Page. Volland provides unique data showing where dealers are positioned providing in my opinion a higher degree of conviction to where price may move to.
Vanna - Levels where price may repel or act as magnet
Remember for price to go above spot through a magnet or repellent VIX and IV must decrease or stay flat. For price to go below spot through a magnet or repellent VIX and IV must increase.
Positive vanna - will act as magnet
Negative vanna - will act as repellent
When price goes through a positive or negative level it will flip it - ie negative becomes positive and vice versa.
Above Spot:
4560-4565 - negative vanna
4580 - negative vanna
4600 - negative vanna
Below Spot:
4550 - negative vanna
4505 - negative vanna
4490 - negative vanna
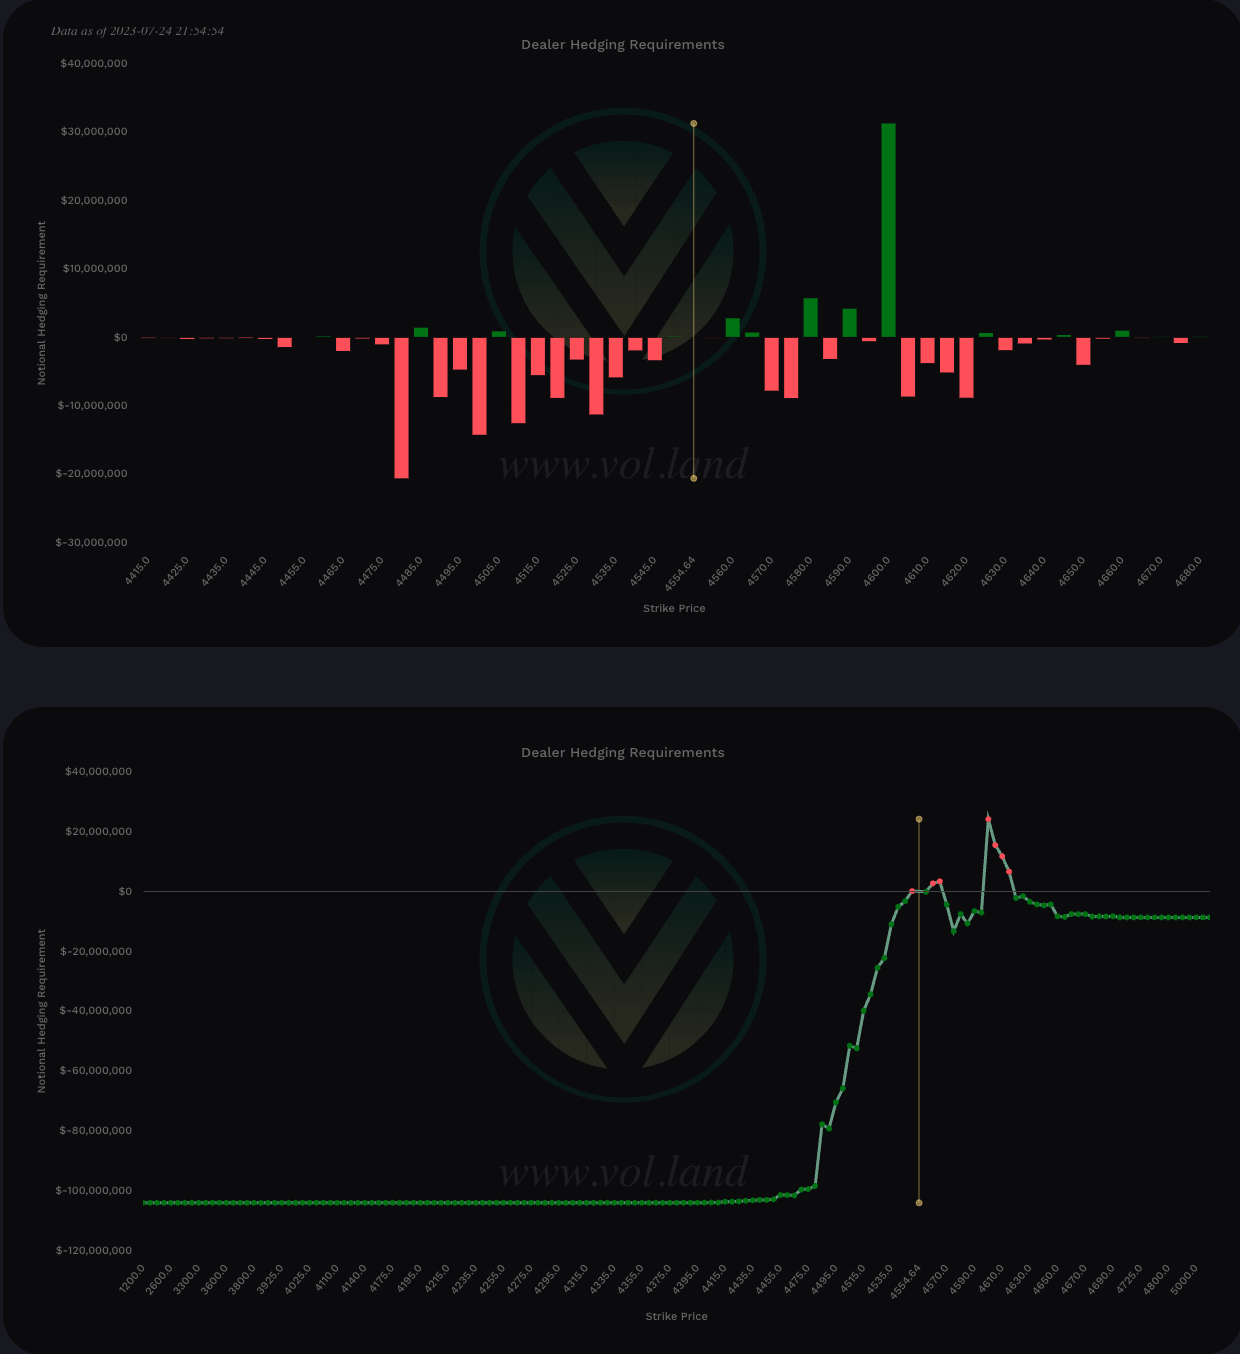
Gamma
Positive Gamma Above Spot - acts as resistance - meaning that dealers want to push against the move
Positive Gamma Below Spot - acts as support - meaning that dealers will want to support price at these levels
Negative Gamma - becomes permissive to price as it moves there - aka neither resistance nor support - simply just chillin and watching what’s happening…
Let’s translate below…The positive gamma sitting at 4555-4575 means that dealers will not assist any move in that range, but at any point and time they will say “ok enough is enough” and put an end to the rally.
Similarly if price sells below 4550 it means dealers will not assist nor put any resistance to the price as it floats through those levels.
Above Spot:
4555-4575 - positive gamma
4585 - positive gamma
Below Spot:
4550 - positive gamma
4500 - positive gamma
4475 - positive gamma
Charm
Remember if IV is not expanding charm will start to overtake Vanna especially 0DTE as it comes closer to expiration.
For all expiry’s, Charm total notional value is bullish - negative is bullish and positive bearish - take the total of the far left and far right values. This is a longer term view of the market and suggests we find key dips to buy to long.
The 0DTE view on SPX Charm shows a bullish trend. We will want to wait and see what the 10am est Volland30 update provides us what paradigm the SPX will have and potential trend on targets for the day. Currently, looking at charm we see a GEX paradigm suggesting price will target 4575.
To cover our basis…
Welcome to my Substack where I provide a daily SPX trading plan to help guide my intraday trading. The purpose of this letter is not to advice you on your trading or investment decisions. I am simply documenting my daily trading plan for myself to help with planning and execution. These are simply my opinions and the data sourced from the likes of vol.land, TradingView, Quant Data and others. The stock market is risky, gains are not guaranteed. This is not about getting rich quick, but learn to educate yourself and make the necessary financial decisions on your own. This is not financial advice.


