March 25, 2024 SPX, ES, SPY Trade Plan
Weekly Market Overview
Hello fellow traders and welcome to another week of our trading plan. Before we get into this week’s overview of the market let’s do an overview of our trading week.
Monday - $418 - back and forth day was down and then scalped my way back into a green PnL day
Tuesday - $640 - went long calls went from avg 17 to 18.60
Wednesday - $2,700 - went long on the heels of FOMC
Thursday - $-706 - went long but no dice stop loss triggered
Friday - $995 - went short and nailed our downside target
Alright so what is in store for this week? From a news standpoint there is quite a bit of data coming out this week and we also have 4 trading days this week as the market is closed on Friday for Easter weekend observation.
On the news front let’s keep an eye out Tuesday for Consumer Confidence, Wednesday we have FED Member Waller speaking and we wrap up the week Thursday with GDP, Unemployment Claims, Chicago PMI, Pending Home Sales, and Consumer Sentiment and Inflation Expectations. You could say that Thursday might be volatile!
Let’s look at some data and what’s happening with the market from a macro standpoint…
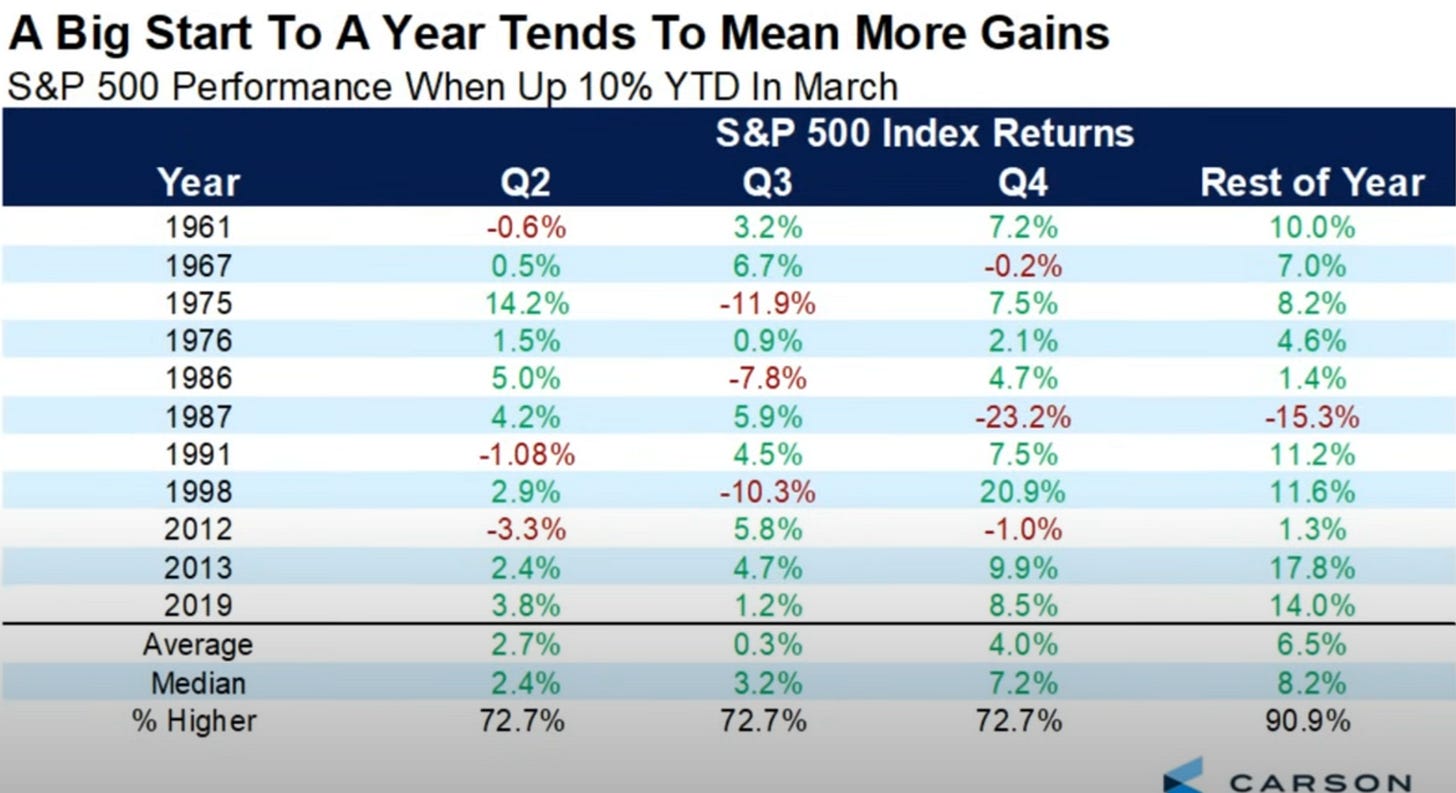
A big start to the year typically leads to more gains… When the SPX is 10% YTD in March that means for the rest of the year we rally another 6.5% with Q2 and Q4 are highest quarters of return the rest of the year…
Let’s also dissect the latest study by Wayne Whaley - you should use last week’s trade plan provided on Sunday/Monday as reference - where he dissects what this week could do. Basically, the 10 days between March 14-24 predicts what this week will do. IF those 10 days are up above 1.2% then this week has been negative 7 times out of 8. This is the far right table…

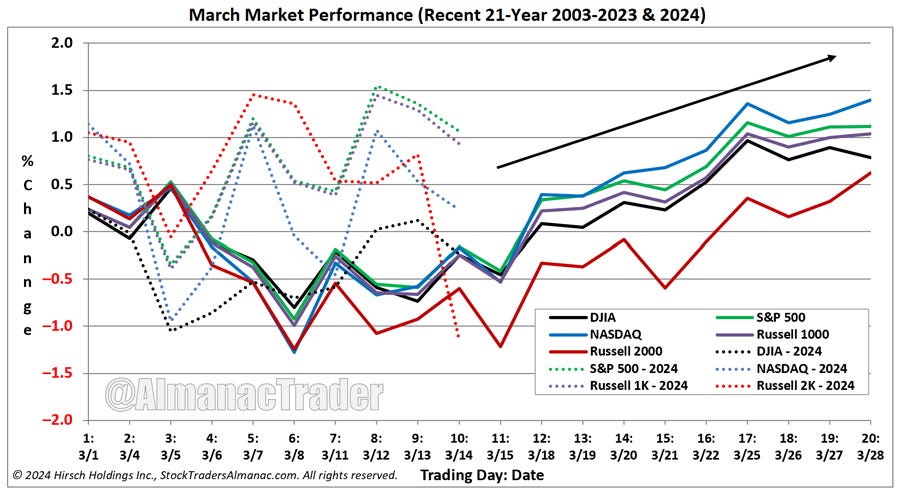
This aligns with March’s seasonality view…
Last, but not least I leave you with this goodie…
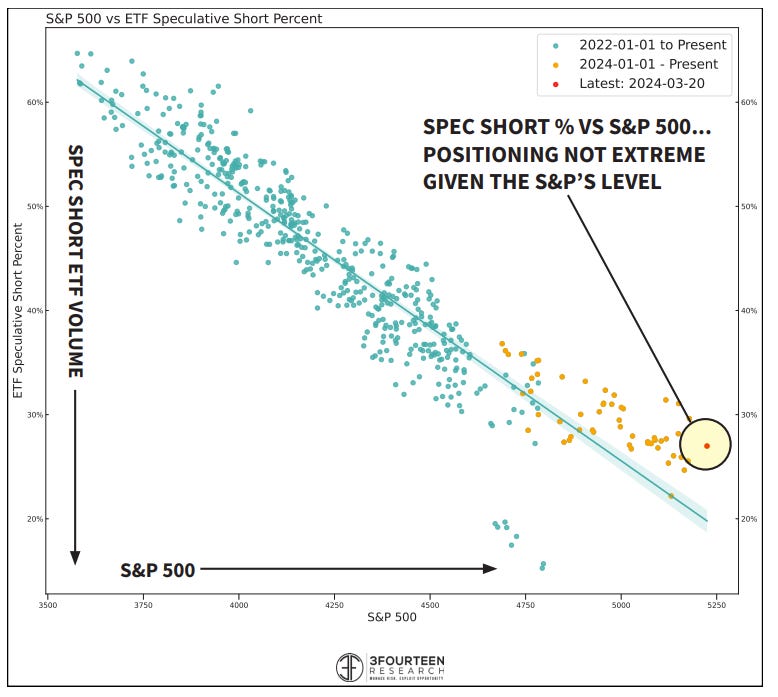
Spec short volume rises to ~60% at market bottoms and falls to ~20% at market tops. Spec short ETF volume is falling but were not at extreme levels yet, stocks can definitely go higher
As I have been saying since our failed short trade back in January this is a buy the dip and scalp any shorts kind of market. So just because we have some data suggesting a red week I wouldn’t get to comfy staying in puts especially if we trigger a key level so maintain our rules - 10-15 pts take profits, reassess and attack again.
What are some of those critical buy the dip levels on higher timeframes IF we get to them?
Note: If you are looking for a swing trade idea - if we get a failed breakdown scenario with any of these levels I would consider a long position into a end of Q2 expiry or EOY expiry such as January 2025. I would look for a failed breakdown scenario with a daily candle close and/or weekly candle close above these key levels.
5200-5175 - this is currently Q1’s VAH and near March’s VAH
Since both VAH’s are forming and how strong of a vanna level it is starting to form I would say they will get closer to 5200 than below 5175…
5120-5100 - there is a lot in this area such as
5117 - 3/18 weekly POC
5111 - February’s Monthly High
5107 - March’s VAL
5104 - 3/11 weekly VAL
5100 - major large negative vanna
We close a weekly candle below 5100 and I think that means a bigger selloff towards 5000 and then 4950…
Let’s jump into Monday’s trade plan…
Just a reminder - Transition to Discord…
One more week - end of March - and we will be discontinuing our Substack in favor of our transition to Discord. Haven’t made the transition yet? Below are details…
All of these updates were provided in real time in our Discord server. If you are an existing subscriber and haven’t received an email on how to transition to Discord please email me at darkmattertrade@gmail.com. For the subject line please add “Access to Discord.”
📈 Don't miss out on key levels, expert trade ideas, daily plans, and intraday updates for only $29.99/month.
💰 Click subscribe now and supercharge your trading game! 🚀
#TradeSmart #LimitedTimeOffer
SUBSCRIBE
Gamma Levels - GEX
Here is an overview of the Gamma/GEX data we are seeing longer term…
Customers are treating this market as positive gamma - buy the dips
5200, 5250, 5225 are your top net GEX levels
5250 and 5300 is showing a lot of interest from customers…
There will be a squeeze if we break and hold 5250…
5200 is positive gamma suggesting we will be supportive if price visits it
5155 is a key pivot - below will trigger a larger selloff and push us back into negative gamma
4800 is a key level of support
Here is what it looks like intraday or 0DTE…
We are sitting in a really tough zone where bulls and bears are fighting on 0DTE
TLDR is 5250 the high but I don’t see us cracking 5240 where we have a lot of puts/negative gamma which if proven right pushes price towards 5195 below 5225
5200 is an area of support
5195 is where the market starts to get negative gamma - aka sell the rips
5250 is a key upside target and resistance
3/25 News Catalysts
New home sales will be a bump in data on the day…
For more information on news events, visit the Economic Calendar
Just a reminder for those not subscribed to the newsletter your access will end here for you.

You can still join us for the rest of the plan where we discuss key levels and entries to take and targets.

There is a 5 day free trial for access into our new Discord channel. 


