November 22, 2023 SPX, SPY, ES Trade Plan
Market Recap
Another great trade plan laid out…the only thing I am sad is that our ES/futures traders took part in the fun sooner than some of us by almost 10pts with a classic failed breakout at 4550.
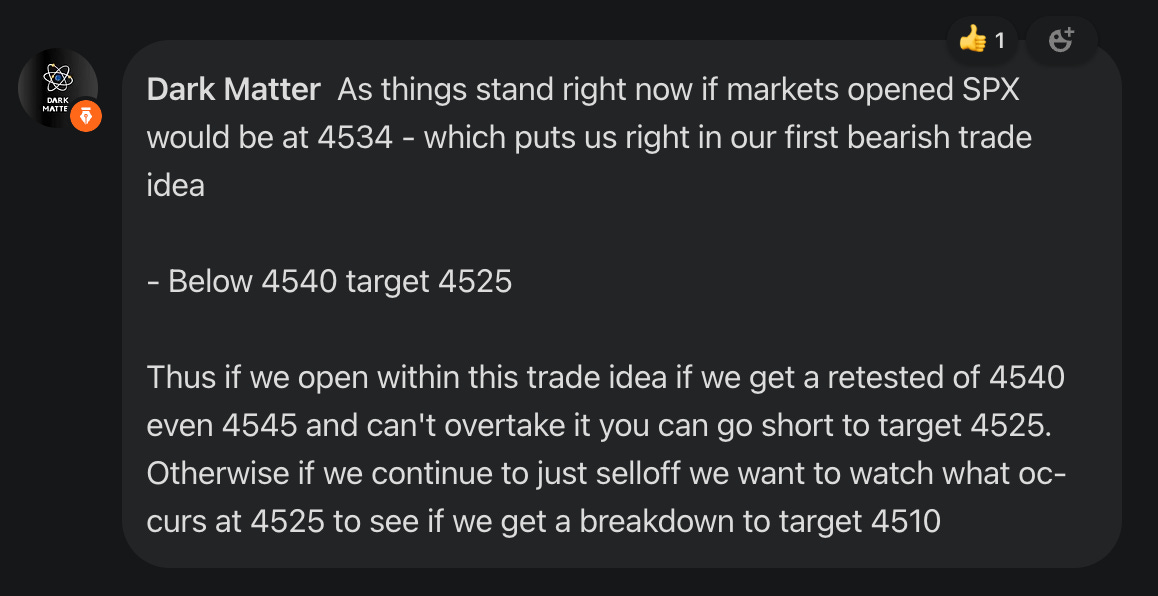
Additionally, we guided our intraday traders in our chat room before the market opened with an update including that our plan was fully in tact and we had a nice short opportunity to the down side if we got back near to 4540 targeting our first target at 4525. I was able to enter at 4537 where it tested this level multiple times on the 5 min chart before selling off relatively fast to our target. Unfortunately, we had no continuation and instead a failed break down of 4525 targeting 4542.
Back to our overnight traders, the fun began for them where at 4565 on ES we started to find resistance and sold off from this level. See in the chart below how we rode this level and when we finally had some volume it immediately pushed price down.
From our trade plan…
For the bears they need to defend 4550. Must defend it. If they can they will push price towards 4540 where if we go below we target 4525. Below 4525 we target 4510 and then 4500.
In the below chart notice how all night in futures we just rode this level at 4565 and it finally caved. Taking this failed breakout and riding it to the target we achieved in regular trading hours would have netted out a 30pt trading day! That is massive…

For those who haven’t subscribed this is a great opportunity to subscribe.
For as little as $15/month we provide daily trade plans for intraday traders and also provide great educational content.
Tomorrow on the news front brings us Unemployment Claims, Durable Goods Orders, and the UoM Consumer Sentiment and Inflation Expectations. The first two premarket and the other two at 10am est.
I finally want to share with you another interesting stat shared by Wayne Whaley on X.

Last, but not least I find it shocking that after such a rally as we have experienced retail traders are still very bearish. This is why we have our key levels!!! Right folks…
Now let’s jump into the daily trade plan…
11/22 SPX/SPY/ES Intraday Overview (TL;DR)
We have news premarket and then shortly after the open at 10am est. So we could find us chopping in that first half hour finding balance to find a trend up or down…
The zone between 4530-4550 is a sideways affair and once again a zone where accumulation is occurring to gear up for the next move. Thus I would only play failed break downs or breakouts in this zone. For example, I would go long if we have a failed break down of 4530 where we trade to 4530 or even overshoot it to then overtake it and go long at 4535 to target 4545-4550.
I would be careful with a failed breakout of 4550 and shorting it as this could be a counter trend if we get any push through past this zone where price has had a tough time breaking through.
With that said if I am a bull I want to go long on the failed break down of 4530 targeting 4545-4550. If we get further continuation we will target 4575 where we could face speed bumps at 4560 and 4570 so manage your trades near 4570. Should we continue to push up and hold 4575 we target 4595.
If you are a bear you need to push price below 4530. Again you could wait and see how 4550 trades and if we get a failed break out, but it is more risky. Ideally, we break down 4530 and hold it to target 4515 then 4500. Should we get an increasing VIX we target 4480. Expect some speed bumps/consolidation at 4490.
News Catalysts
8:30am est - Unemployment Claims
8:30am est - Durable Goods Orders
10:00am est - Revised UoM Consumer Sentiment
10:00am est - Revised UoM Inflation Expectations
For more information on news events, visit the Economic Calendar
11/22 - SPX/ES/SPY Trade Plan
Bullish bias:
Above 4551 target 4575
Expect bumps/consolidation at 4560 and 4570
If VIX continues going down then a breakout of 4575 targets 4595
If there is a failed break down of 4530 target 4545
Bearish bias:
Below 4530 target 4515
If VIX continues going up then a breakdown of 4515 targets 4500
If we break down 4500 target 4480
Expect bumps/consolidation at 4490
As always keep an eye on Volland30 and the VIX for trend continuation or reversals.
Remember you can use this SPX trade plan to trade ES or SPY. ES value is approx. 15pts more than the SPX levels shared. To get SPY levels simply take the SPX levels and divide by 10.03.
SPX - The Why Behind the Plan
Key Levels
Above Spot:
4539 - 11/21 Daily VAH
4545-4550 - negative vanna
4545 - Q3 VAH
4547 - 11/20 Daily POC - hasn’t been breached
4557 - November’s VAH
4557 - 11/20 VAH
4567 - 7/24 Weekly POC - hasn’t been breached
4575 - negative vanna
4573-4594 - OB (1D chart)
4583 midline
4577 - 7/31 Weekly POC - hasn’t been breached
4595-4600 - negative vanna
4596 - July’s VAH
Below Spot:
4530 - negative vanna
4534 - 11/21 VAL
4500 - negative vanna
4511-4489 - OB (2hr chart)
4501 midline
4513 - 11/13 Weekly VAH
4508 - 11/13 Weekly POC - hasn’t been breached
4507 - 11/17 VAL
4505 - November’s POC
4498 - 11/16 VAL
4493 - 11/13 Weekly VAL
4487 - 2D Low
4480 - negative vanna
4460-4450 - negative vanna
4450 - Q3 POC
Volume Profile & Trends
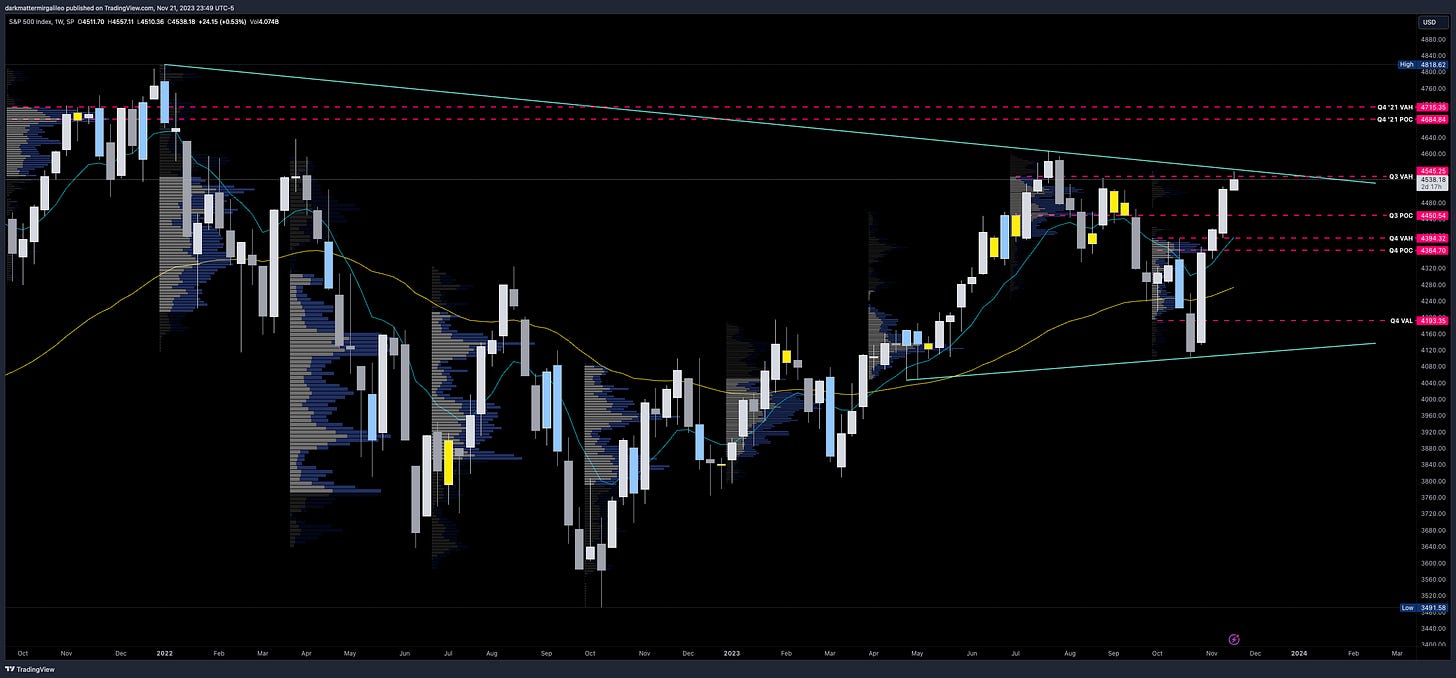
All eyes are on price targeting this down trend line connecting the all-time highs and the highs from July 2023. We didn’t quite get there in Monday’s session nor did we in Tuesday’s session.

Let’s review our volume profiles…
From a quarterly volume profile on the weekly chart some key levels are seen.
4715 - Q4 2021 VAH
4684 - Q4 2021 POC
4545 - Q3 VAH
4450 - Q3 POC
4394 - Q4 VAH
4364 - Q4 POC
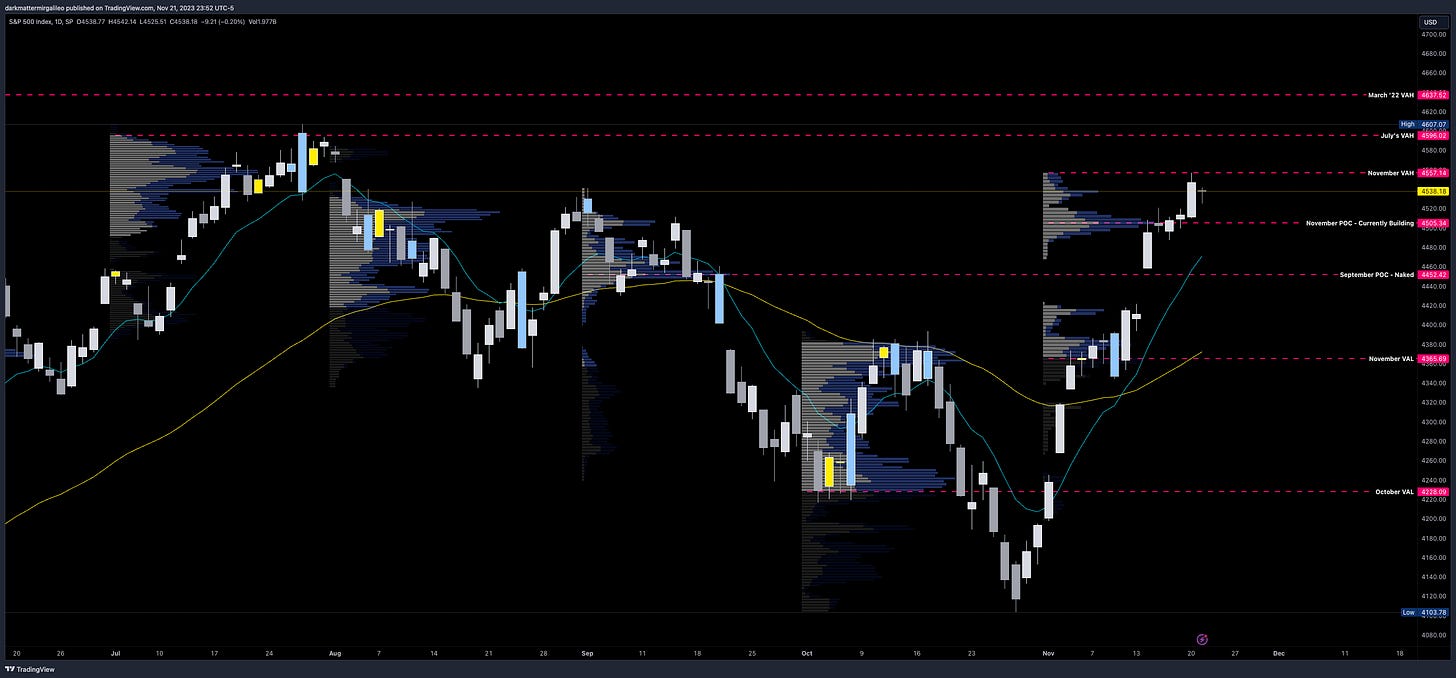
If we take a look at the daily chart and review the monthly volume profile we find the following levels…
4637 - March ‘22 VAH
4596 - July’s VAH
4557 - November’s VAH
4505 - November’s POC
4452 - September’s POC - hasn’t been breached
Let’s now look at the 4hr chart and review what the weekly volume profile levels show.
4594 - 7/31 Weekly VAH
4577 - 7/31 Weekly POC - hasn’t been breached
4567 - Gap Fill
4567 - 7/24 Weekly POC - hasn’t been breached
4542 - 11/20 Weekly VAH - still forming
4523 - 11/20 Weekly VAL - still forming
4513 - 11/13 Weekly VAH
4508 - 11/13 Weekly POC - hasn’t been breached
4493 - 11/13 Weekly VAL
4466 - 9/18 Weekly VAH
4453 - 9/18 Weekly POC - hasn’t been breached
On the smaller timeframe and intraday let’s go to our 30min chart where we will put our session volume profile on. Our levels of importance are…
4557 - 11/20 VAH
4547 - 11/20 POC - hasn’t been breached
4539 - 11/21 VAH
4534 - 11/21 VAL
4507 - 11/17 VAL
4498 - 11/16 VAL
4487 - 2D Low
4458 - 2D Low
Orderblocks (OB) and Fair Value Gaps (FVG)
These are smart money concepts and some areas I am looking to see how price reacts. I will give higher credence to OB’s whereas FVG’s could be areas of basing/consolidation if they break. I use Sonarlab’s indicator on Tradingview to plot these.
Resistance levels - at these levels I want to see if price rejects to short or consolidates for a push up. I couple this data with Volland, intraday option flows, and Dark Pool levels. Higher timeframe OB’s or FVG will be harder to break. OB’s are the stronger levels over FVG’s.
4573-4594 - OB (1D chart)
4583 midline
4652-4665 - OB (2hr chart)
4658 midline
4414-4541 - OB (1W chart)
4476 midline
4507-4637 - OB (1W chart)
4572 midline
Support levels - at these levels I want to see if price rejects to long or consolidates for a push down. I couple this data with Volland, intraday option flows, and Dark Pool levels. Higher timeframe OB’s or FVG will be harder to break. OB’s are the stronger levels over FVG’s.
4511-4489 - OB (2hr chart)
4501 midline
4416-4410 - OB (30min chart)
4413 midline
4393-4343 - OB (1D chart)
4369 midline
4375-4343 - OB (4hr chart)
4359 midline

Volland Data
For a better understanding of the various greeks below I would suggest you visit the Volland YouTube Page. Volland provides unique data showing where dealers are positioned providing in my opinion a higher degree of conviction to where price may move to.
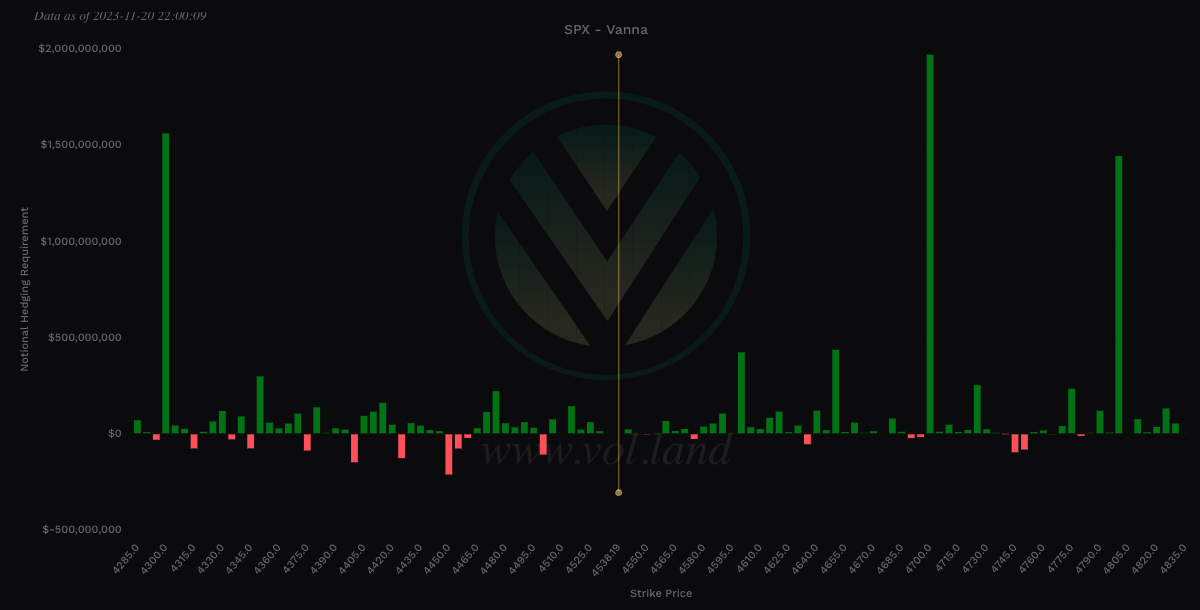
Vanna - Levels where price may repel or act as magnet
Remember for price to go above spot through a magnet or repellent VIX and IV must decrease or stay flat. For price to go below spot through a magnet or repellent VIX and IV must increase.
Positive vanna - will act as magnet
Negative vanna - will act as repellent
When price goes through a positive or negative level it will flip it - ie negative becomes positive and vice versa.
Above Spot:
4545-4550 - negative vanna
4575 - negative vanna
4595-4600 - negative vanna
4635 - negative vanna
4675 - negative vanna
Below Spot:
4530 - negative vanna
4500 - negative vanna
4480 - negative vanna
4460-4450 - negative vanna
4425 - negative vanna
4400 - negative vanna
Weekly Option Expected Move
SPX’s weekly option expected move is ~48.89 points. SPY’s expected move is ~4.99. That puts us at 4562.92 to the upside and 4465.14 to the downside. For SPY these levels are 455.78 and 445.80.
Remember over 68% of the time price will resolve it self in this range by weeks end.
TradingView Chart Access
For access to my chart laying out all of the above key levels please visit here.
To cover our basis…
Welcome to my Substack where I provide a daily SPX trading plan to help guide my intraday trading. The purpose of this letter is not to advice you on your trading or investment decisions. I am simply documenting my daily trading plan for myself to help with planning and execution. These are simply my opinions and the data sourced from the likes of vol.land, TradingView, Quant Data and others. The stock market is risky, gains are not guaranteed. This is not about getting rich quick, but learn to educate yourself and make the necessary financial decisions on your own. This is not financial advice.


