November 24, 2023 SPX, SPY, ES Trade Plan
Market Recap
The market continues to tread higher and higher but is grinding along as we saw on Wednesday. What looked like a day where we would get some trend continuation we opened in our first trade idea breaking above 4551 and we quickly made a fast track towards 4567 which was a POC from 7/24 listed on our Volume Profile levels. I had a feeling this was where we would have a speed bump and should have left it as our target as we then faded from this level at 4545 which is another volume profile level at 4545. This is Q3’s value area high (VAH).
We bounced twice from this level in the session the first time trading back near 4565 and then the second time finding balance at 4555.
Going to make this plan a bit shorter than usually to get back to Thanksgiving festivities. Hope you all had a great Thanksgiving if you celebrated.
Note the market is open Friday but with a shorter session. So don’t trade 0DTE’s in general, but if you are expect faster decay in them.
Now let’s jump into the daily trade plan…
For those who haven’t subscribed this is a great opportunity to subscribe.
For as little as $15/month we provide daily trade plans for intraday traders and also provide great educational content.
News Catalysts
9:45am est - Flash Manufacturing PMI
9:45am est - Flash Services PMI
For more information on news events, visit the Economic Calendar
11/24 SPX/SPY/ES Intraday Overview (TL;DR)
We have news after market open which could guide the trend on the day so be aware and the market will be closing earlier than normal around 1 pm est.
The zone between 4545 and 4577 is pure chop. We only want to trade on failed breakouts or breakdowns in this area - don’t go chasing anything.
If you are bullish you want to defend that 4555-4545 zone. If you defend this you continue towards 4575. Above 4577 target 4595 and if we get further continuation target 4610. Let’s say we sell back towards 4545 I would then wait till 4560 to break to long pushing us towards 4575 and then see the reaction at this level for any continuation.
For the bears you can’t let price get above 4575 - defend that and you can get price towards 4555 then 4545. The safer short comes on the break down of 4545 to target 4525. I might even wait to go short at 4540 to play it safer. Below 4525 target 4510 then 4500.
In summary we could have choppy conditions especially on low volume so don’t let green trades go red…
11/24 - SPX/ES/SPY Trade Plan
Bullish bias:
Above 4577 target 4595
If VIX continues going down then a breakout of 4596 targets 4610
If there is a failed break down of 4555 target 4575
Bearish bias:
If there is a failed break out of 4565 target 4555
Below 4545 target 4525
If VIX continues going up then a breakdown of 4525 targets 4510
If we break down 4510 target 4500
As always keep an eye on Volland30 and the VIX for trend continuation or reversals.
Remember you can use this SPX trade plan to trade ES or SPY. ES value is approx. 11pts more than the SPX levels shared. To get SPY levels simply take the SPX levels and divide by 10.03.
SPX - The Why Behind the Plan
Key Levels
Above Spot:
4565-4575 - negative vanna
4560 - 11/22 VAH
4562 - Channel Break
4568 - November’s VAH - still forming
4573-4594 - OB (1D chart)
4583 midline
4577 - 7/31 Weekly POC - hasn’t been breached
4596 - July’s VAH
4610 - negative vanna
4620 - negative vanna
Below Spot:
4555-4545 - negative vanna
4545 - Q3 VAH
4539 - 11/21 VAH
4538 - 11/21 POC - hasn’t been breached
4537 - 11/20 Weekly VAL - still forming
4534 - 11/21 VAL
4525 - negative vanna
4510 - negative vanna
4513 - 11/13 Weekly VAH
4511-4489 - OB (2hr chart)
4501 midline
4508 - 11/13 Weekly POC - hasn’t been breached
4507 - 11/17 VAL
4505 - November’s POC - still forming
4500 - negative vanna
4498 - 11/16 VAL
4493 - 11/13 Weekly VAL
4487 - 2D Low
4466 - 9/18 Weekly VAH
4460-4440 - negative vanna
4450 - Q3 POC
Volume Profile & Trends
All eyes are on price targeting this down trend line connecting the all-time highs and the highs from July 2023. We breached it in Wednesday’s trading session, but were immediately rejected and sucked back in.

Additionally, I am looking at this channel - in red - where we have been trading in between since the beginning of the week. We also have a up trend line that has been respected starting from 11/16.

Let’s review our volume profiles…
From a quarterly volume profile on the weekly chart some key levels are seen.
4715 - Q4 2021 VAH
4684 - Q4 2021 POC
4545 - Q3 VAH
4450 - Q3 POC
4391 - Q4 VAH - still forming
4364 - Q4 POC - still forming
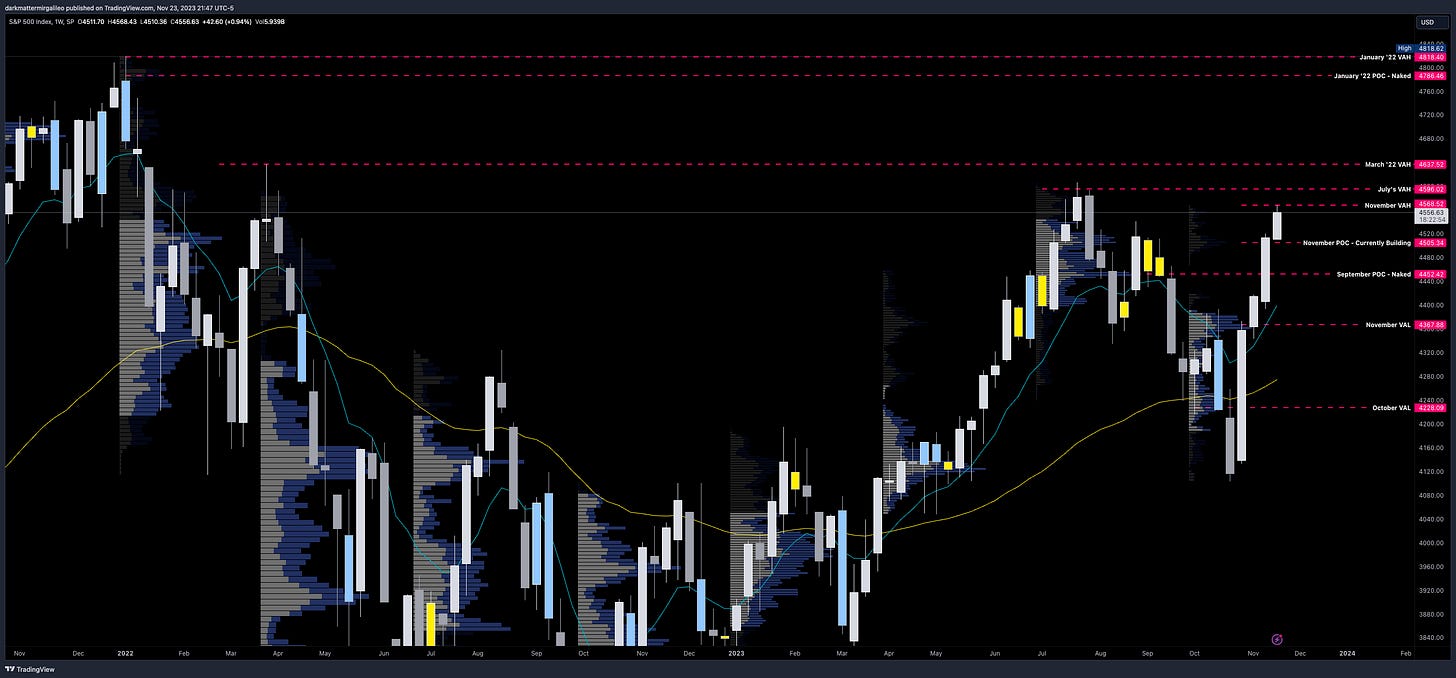
If we take a look at the daily chart and review the monthly volume profile we find the following levels…
4637 - March ‘22 VAH
4596 - July’s VAH
4568 - November’s VAH - still forming
4505 - November’s POC - still forming
4452 - September’s POC - hasn’t been breached
Let’s now look at the 4hr chart and review what the weekly volume profile levels show.
4594 - 7/31 Weekly VAH
4577 - 7/31 Weekly POC - hasn’t been breached
4568 - 11/20 Weekly VAH - still forming
4537 - 11/20 Weekly VAL - still forming
4513 - 11/13 Weekly VAH
4508 - 11/13 Weekly POC - hasn’t been breached
4493 - 11/13 Weekly VAL
4466 - 9/18 Weekly VAH
4453 - 9/18 Weekly POC - hasn’t been breached
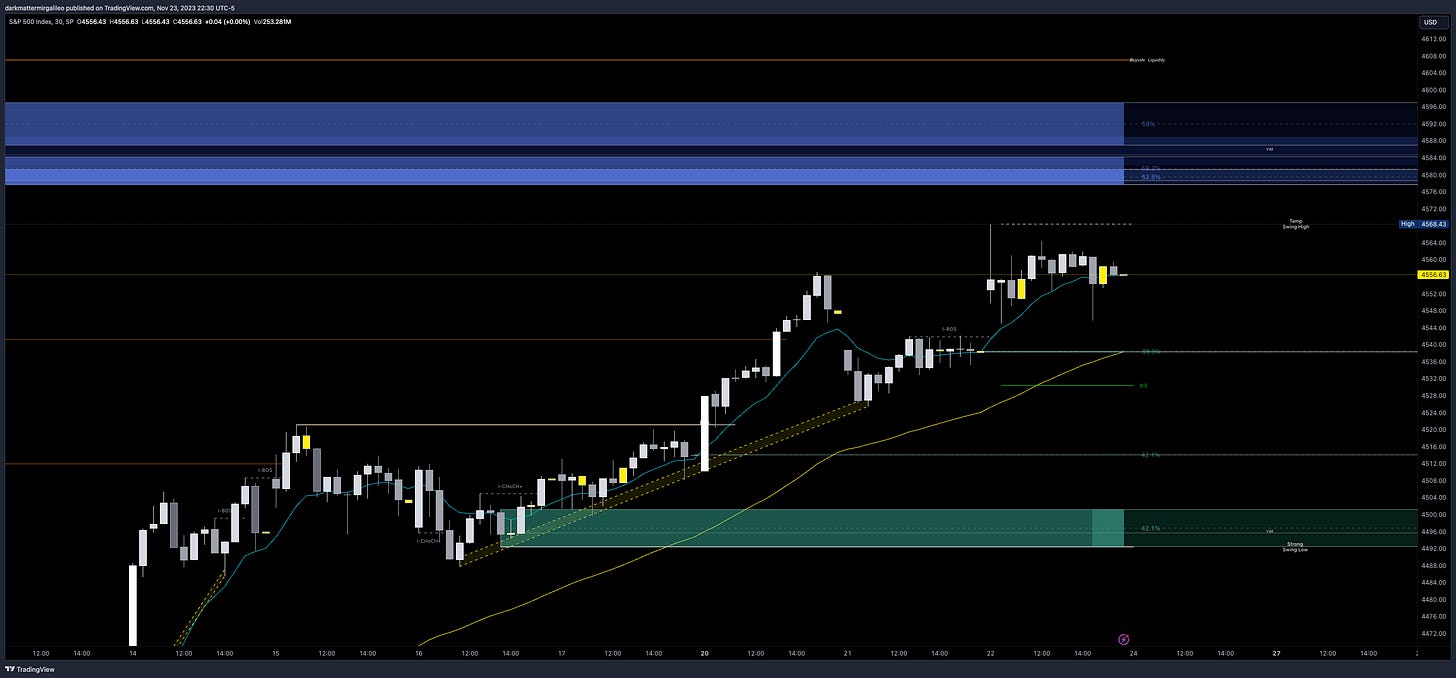
On the smaller timeframe and intraday let’s go to our 30min chart where we will put our session volume profile on. Our levels of importance are…
4560 - 11/22 VAH
4554 - 11/22 VAL
4539 - 11/21 VAH
4538 - 11/21 POC - hasn’t been breached
4534 - 11/21 VAL
4507 - 11/17 VAL
4498 - 11/16 VAL
4487 - 2D Low
4458 - 2D Low
Orderblocks (OB) and Fair Value Gaps (FVG)
These are smart money concepts and some areas I am looking to see how price reacts. I will give higher credence to OB’s whereas FVG’s could be areas of basing/consolidation if they break. I use Sonarlab’s indicator on Tradingview to plot these.
Resistance levels - at these levels I want to see if price rejects to short or consolidates for a push up. I couple this data with Volland, intraday option flows, and Dark Pool levels. Higher timeframe OB’s or FVG will be harder to break. OB’s are the stronger levels over FVG’s.
4573-4594 - OB (1D chart)
4583 midline
4652-4665 - OB (2hr chart)
4658 midline
4414-4541 - OB (1W chart)
4476 midline
4507-4637 - OB (1W chart)
4572 midline
Support levels - at these levels I want to see if price rejects to long or consolidates for a push down. I couple this data with Volland, intraday option flows, and Dark Pool levels. Higher timeframe OB’s or FVG will be harder to break. OB’s are the stronger levels over FVG’s.
4511-4489 - OB (2hr chart)
4501 midline
4416-4410 - OB (30min chart)
4413 midline
4393-4343 - OB (1D chart)
4369 midline
4375-4343 - OB (4hr chart)
4359 midline

Volland Data
For a better understanding of the various greeks below I would suggest you visit the Volland YouTube Page. Volland provides unique data showing where dealers are positioned providing in my opinion a higher degree of conviction to where price may move to.
Vanna - Levels where price may repel or act as magnet
Remember for price to go above spot through a magnet or repellent VIX and IV must decrease or stay flat. For price to go below spot through a magnet or repellent VIX and IV must increase.
Positive vanna - will act as magnet
Negative vanna - will act as repellent
When price goes through a positive or negative level it will flip it - ie negative becomes positive and vice versa.
Above Spot:
4565-4575 - negative vanna
4610 - negative vanna
4620 - negative vanna
4635 - negative vanna
Below Spot:
4555-4545 - negative vanna
4525 - negative vanna
4510 - negative vanna
4500 - negative vanna
4460-4440 - negative vanna
Weekly Option Expected Move
SPX’s weekly option expected move is ~48.89 points. SPY’s expected move is ~4.99. That puts us at 4562.92 to the upside and 4465.14 to the downside. For SPY these levels are 455.78 and 445.80.
Remember over 68% of the time price will resolve it self in this range by weeks end.
TradingView Chart Access
For access to my chart laying out all of the above key levels please visit here.
To cover our basis…
Welcome to my Substack where I provide a daily SPX trading plan to help guide my intraday trading. The purpose of this letter is not to advice you on your trading or investment decisions. I am simply documenting my daily trading plan for myself to help with planning and execution. These are simply my opinions and the data sourced from the likes of vol.land, TradingView, Quant Data and others. The stock market is risky, gains are not guaranteed. This is not about getting rich quick, but learn to educate yourself and make the necessary financial decisions on your own. This is not financial advice.


