October 2, 2023 SPX, SPY, ES Trade Plan
Weekly Market Overview
Alright team welcome to another installment of the Dark Matter Trade Plan. Before we kick into next weeks outlook and tomorrow’s trading session let’s take a minute to review Friday’s trading session.
What at first seemed to be another choppy sideways action day quickly turned into a nice whipsaw action down then up and then down - which is to be expected with any kind of major OPEX period and within a larger timeframe downtrend. OPEX is why I don’t trade these days more times than not and if I am I am seeking quick 10pt moves and seeing how price reacts then.
Now let’s chat a bit about key levels. In Friday’s plan we discussed that the following levels were important to us and I will summarize them a bit here…
Above Spot:
4320-25
4335
Below Spot:
4290
4280
4270
We barely got to our target at 4335 where we then had news come out around 10am est where it finally tried to break back towards 4335 only to be rejected, which began that slow selloff.
As we sold off we then found another new resistance at 4325 where price was rejected on 2 different occasions.
In the trade plan I originally mentioned that a failed breakout of 4315 would started a trend down. If we looked at new data as the trading session continued a negative vanna was created at 4325 and charm’s 0DTE pointed to a bearish stance. On top of that, we had new orderblocks - bearish - formed above spot at these key levels and everytime they popped back into those orderblocks we had rejection.
Unfortunately, as I mentioned I wasn’t trading, but had I been this is what I would have looked at and then gone to the 15min and 30min timeframes for confirmation or further conviction of where I could put a stop loss. Our trade plan still provided the key bearish levels to trade from and those targets hit as well.
In summary, what I am getting at here and I am still guilty of doing this at times is that data and price change in a very heavy 0DTE paradigm. We need to be paytient, agile, change our outlooks, assess new key levels and then react and take trades from there.
As you all are seeing futures - ES - has gapped up considerably due to the government averting a shutdown. Wow the theater that these politicians bring to our daily lives. So what does this mean? Ultimately not much as it is just a stopgap to fund the gov’t until November 17. Good that it passed bi-partisan support, but we have more drama ahead of us as neither Ukraine nor border security funding went into this stopgap funding.
The news might not matter overnight much as we open the trading day with news data with the ISM Manufacturing PMI and a slew of FED speakers including Powell, Harker, and Bar all speaking.
Before we get into the intraday trade plan let’s review some interesting bits of data as we head into the last few months of the trading year….
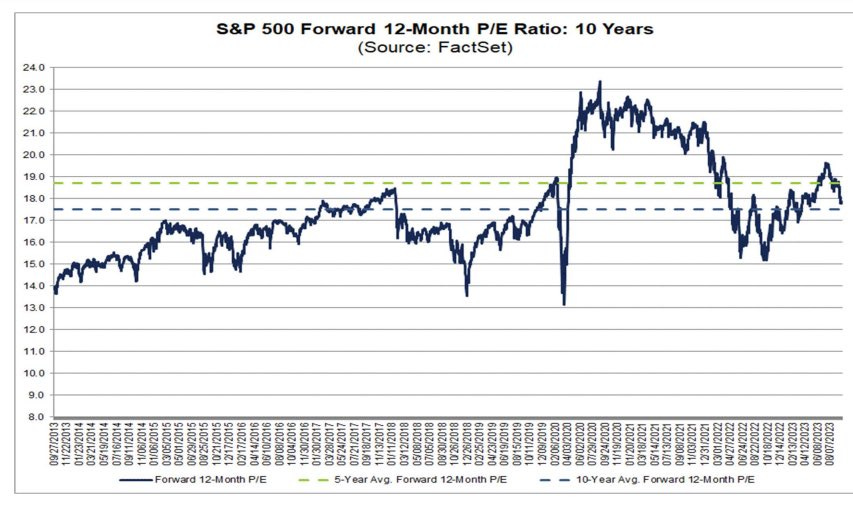
Looking at the SPX Forward 12 Month P/E Ratio we are starting to find some balance in between 5 and 10 year avgs. In between 17.5 to 18.5. You could say we are at a key critical area to determine if we go risk on or risk off in equities.
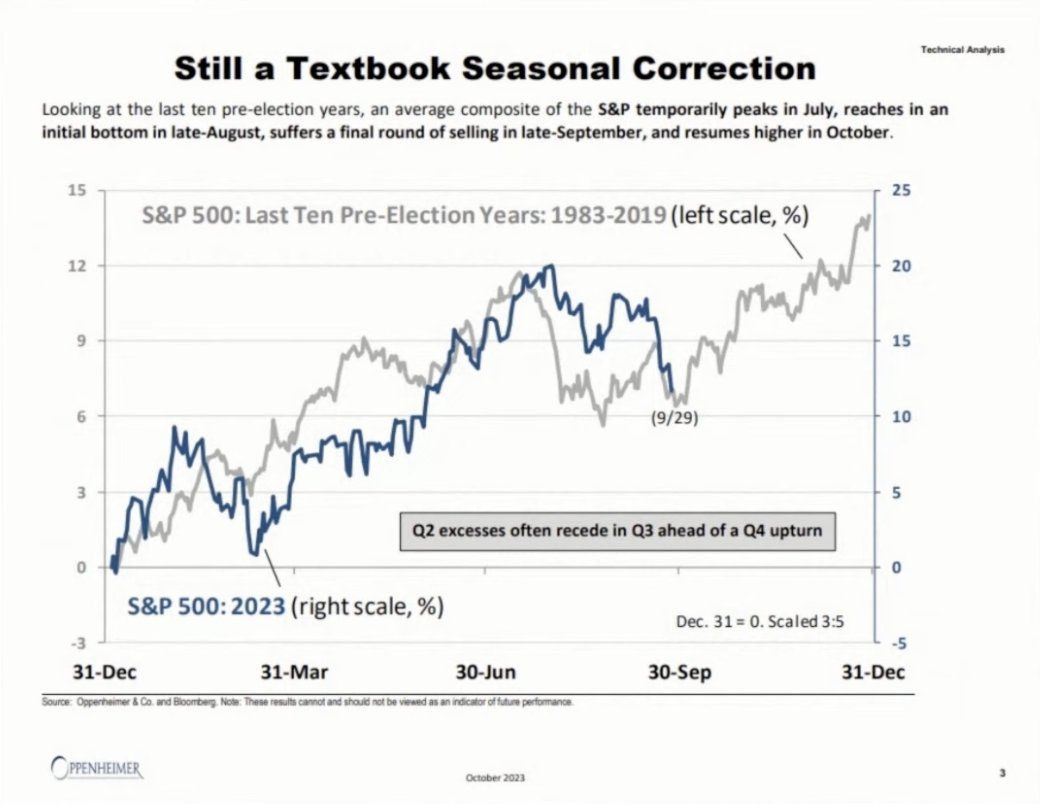
What about seasonality? We shared a couple months back that August and September are some of the bearish months and we got that exactly. So what about the remainder of the year? October turns into a bullish run that finds a higher low bottom before takeoff into November and December. Note this seasonality chart is based on pre-election years.

Let’s look at the bearish sentiment. It is everywhere and on top of that we are finding the market has reached the same bearish sentiment we had at the highs in 2022.
What’s the 6-month outlook? More bearish sentiment. This chart when we hit typically 40% or higher either bullish or bearish we tend to see reversals…
Now does it mean with futures gapping up the bull train has left? Not quite yet…What I want to see is in the below chart the bullish index start to turn. This is a weekly view of it, but as you can see this chart as long as it maintains an uptrend it pulls the SPX with it even with dips/pullbacks in the SPX.
The last data I will share with you is this study by Wayne Whaley at Waynewhaley.com in his comparison of the 1985 vs 2023 market. Do I think we will get 16% in one quarter? Maybe not and maybe that’s where the similarities end, but it points to an uptrend for the remainder of the year.
Again let’s not speculate or predict and get into the trade plan, but thought it would be best to share a more macro view of the market and past historical data to guide our future trades.
Many of you have asked what does a breakout or breakdown look like and one of the better visuals I can share with you is the below. Please see my intraday trading strategy posting for more details and a video walkthrough.
Dark Matter Trade Room - Chat Room on Substack
SPX/SPY/ES Intraday Overview (TL;DR)
Shutdown averted and what will be a vol crunch into tomorrow right before we get PMI numbers at 10am est.
The bulls want to…


